Resolver los problemas de estadística que involucran el cálculo de intervalos de confianza y pruebas de hipótesis.
Understand the Problem
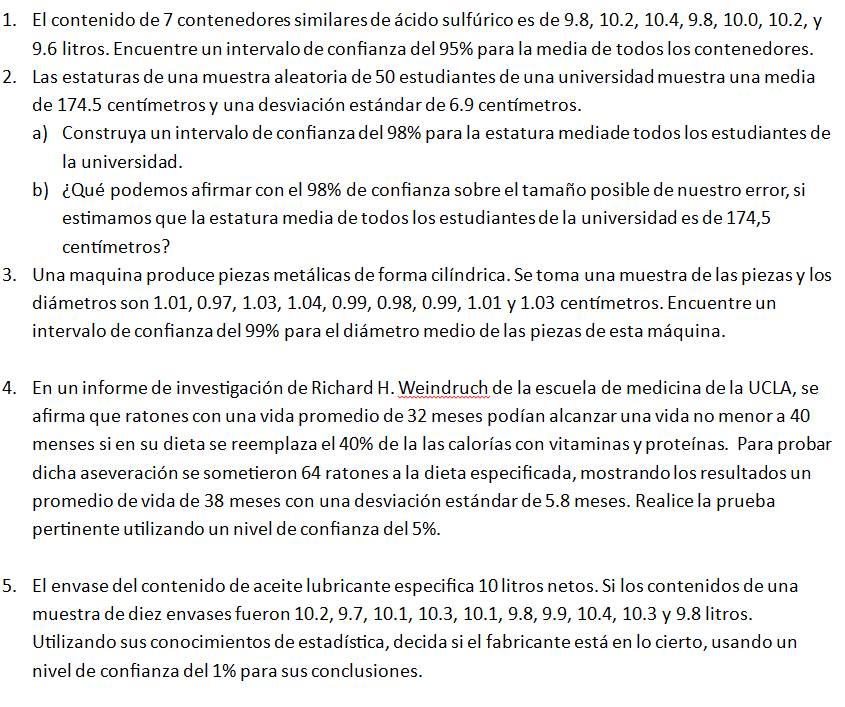
El conjunto de preguntas que se han proporcionado involucran el cálculo de intervalos de confianza y pruebas de hipótesis. El problema 1 pide calcular un intervalo de confianza para la media de una población basándose en los datos de una muestra. El problema 2 pide calcular el intervalo de confianza para la estatura media de los estudiantes y analizar el error. El problema 3 pide calcular un intervalo de confianza para el diámetro medio de unas piezas. El problema 4 pide realizar una prueba de hipótesis sobre la vida media de unos ratones. El problema 5 pide realizar una prueba de hipótesis para determinar si el fabricante está en lo cierto sobre el contenido de los envases de aceite lubricante.
Answer
1. $9.7384 < \mu < 10.2616$ 2. a) $172.2264 < \mu < 176.7736$ b) 2.2736 3. $0.97815 < \mu < 1.03305$ 4. Reject the null hypothesis. 5. Fail to reject the null hypothesis.
Answer for screen readers
- $9.7384 < \mu < 10.2616$
- a) $172.2264 < \mu < 176.7736$ b) Podemos afirmar con un 98% de confianza que el tamaño posible de nuestro error es de aproximadamente 2.2736.
- $0.97815 < \mu < 1.03305$
- Rechazamos la hipótesis nula. Existe evidencia suficiente para concluir que la vida media de los ratones con la dieta especificada es inferior a 40 meses con un nivel de significancia del 5%.
- No rechazamos la hipótesis nula. No hay suficiente evidencia para concluir que el fabricante se equivoca sobre el contenido de los envases de aceite con un nivel de significancia del 1%.
Steps to Solve
- Problem 1: Calculate the sample mean and standard deviation
First, calculate the sample mean ($\bar{x}$) and sample standard deviation ($s$) from the given data: 9.8, 10.2, 10.4, 9.8, 10.0, 10.2, 9.6.
$$ \bar{x} = \frac{9.8 + 10.2 + 10.4 + 9.8 + 10.0 + 10.2 + 9.6}{7} = \frac{70}{7} = 10 $$
$$ s = \sqrt{\frac{\sum_{i=1}^{n}(x_i - \bar{x})^2}{n-1}} $$
$$ s = \sqrt{\frac{(9.8-10)^2 + (10.2-10)^2 + (10.4-10)^2 + (9.8-10)^2 + (10.0-10)^2 + (10.2-10)^2 + (9.6-10)^2}{7-1}} $$
$$ s = \sqrt{\frac{0.04 + 0.04 + 0.16 + 0.04 + 0 + 0.04 + 0.16}{6}} = \sqrt{\frac{0.48}{6}} = \sqrt{0.08} \approx 0.2828 $$ 2. Determine the t-value for the confidence interval
Since the sample size ($n = 7$) is small, we use the t-distribution. We want a 95% confidence interval, so $\alpha = 1 - 0.95 = 0.05$. The degrees of freedom are $df = n - 1 = 7 - 1 = 6$. Looking up the t-value for $\alpha/2 = 0.025$ and $df = 6$ in a t-table, we find $t_{0.025, 6} \approx 2.447$.
- Calculate the margin of error
The margin of error ($E$) is calculated as:
$$ E = t_{\alpha/2, n-1} \cdot \frac{s}{\sqrt{n}} = 2.447 \cdot \frac{0.2828}{\sqrt{7}} \approx 2.447 \cdot \frac{0.2828}{2.6458} \approx 2.447 \cdot 0.1069 \approx 0.2616 $$
- Calculate the confidence interval
The confidence interval is given by:
$$ \bar{x} - E < \mu < \bar{x} + E $$
$$ 10 - 0.2616 < \mu < 10 + 0.2616 $$
$$ 9.7384 < \mu < 10.2616 $$
- Problem 2a: Calculate the margin of error
Given: $n = 50$, $\bar{x} = 174.5$, $s = 6.9$, confidence level = 98%, so $\alpha = 1 - 0.98 = 0.02$. Since $n > 30$, we can use the z-distribution. For a 98% confidence interval, we need the z-score for $\alpha/2 = 0.01$. Looking up $z_{0.01}$ in a z-table, we find $z_{0.01} \approx 2.33$.
The margin of error ($E$) is calculated as:
$$ E = z_{\alpha/2} \cdot \frac{s}{\sqrt{n}} = 2.33 \cdot \frac{6.9}{\sqrt{50}} \approx 2.33 \cdot \frac{6.9}{7.071} \approx 2.33 \cdot 0.9758 \approx 2.2736 $$ 6. Calculate the confidence interval
The confidence interval is given by:
$$ \bar{x} - E < \mu < \bar{x} + E $$
$$ 174.5 - 2.2736 < \mu < 174.5 + 2.2736 $$
$$ 172.2264 < \mu < 176.7736 $$
- Problem 2b: State the margin of error
The margin of error is the value $E$ calculated in the previous part. We can say with 98% confidence that the possible size of our error is approximately 2.2736 cm.
- Problem 3: Calculate the sample mean and standard deviation
First, calculate the sample mean ($\bar{x}$) and sample standard deviation ($s$) from the given data: 1.01, 0.97, 1.03, 1.04, 0.99, 0.98, 0.99, 1.01, 1.03.
$$ \bar{x} = \frac{1.01 + 0.97 + 1.03 + 1.04 + 0.99 + 0.98 + 0.99 + 1.01 + 1.03}{9} = \frac{9.05}{9} \approx 1.0056 $$
$$ s = \sqrt{\frac{\sum_{i=1}^{n}(x_i - \bar{x})^2}{n-1}} $$
$$ s = \sqrt{\frac{(1.01-1.0056)^2 +(0.97-1.0056)^2 + (1.03-1.0056)^2 + (1.04-1.0056)^2 + (0.99-1.0056)^2 + (0.98-1.0056)^2 + (0.99-1.0056)^2 + (1.01-1.0056)^2 + (1.03-1.0056)^2}{9-1}} $$
$$ s = \sqrt{\frac{0.00001936 + 0.00126736 + 0.00059536 + 0.00118336 + 0.00024336 + 0.00065536 + 0.00024336 + 0.00001936 + 0.00059536}{8}} $$
$$ s = \sqrt{\frac{0.00482224}{8}} \approx \sqrt{0.00060278} \approx 0.02455 $$ 9. Determine the t-value for the confidence interval
Since the sample size ($n = 9$) is small, we use the t-distribution. We want a 99% confidence interval, so $\alpha = 1 - 0.99 = 0.01$. The degrees of freedom are $df = n - 1 = 9 - 1 = 8$. Looking up the t-value for $\alpha/2 = 0.005$ and $df = 8$ in a t-table, we find $t_{0.005, 8} \approx 3.355$.
- Calculate the margin of error
The margin of error ($E$) is calculated as:
$$ E = t_{\alpha/2, n-1} \cdot \frac{s}{\sqrt{n}} = 3.355 \cdot \frac{0.02455}{\sqrt{9}} \approx 3.355 \cdot \frac{0.02455}{3} \approx 3.355 \cdot 0.008183 \approx 0.02745 $$
- Calculate the confidence interval
The confidence interval is given by:
$$ \bar{x} - E < \mu < \bar{x} + E $$
$$ 1.0056 - 0.02745 < \mu < 1.0056 + 0.02745 $$
$$ 0.97815 < \mu < 1.03305 $$
- Problem 4: State the null and alternative hypotheses
Null hypothesis ($H_0$): $\mu = 40$ months Alternative hypothesis ($H_1$): $\mu < 40$ months (one-tailed test)
- Calculate the test statistic
Given: $n = 64$, $\bar{x} = 38$, $s = 5.8$, $\mu_0 = 40$, $\alpha = 0.05$.
The test statistic (t-value) is calculated as:
$$ t = \frac{\bar{x} - \mu_0}{s / \sqrt{n}} = \frac{38 - 40}{5.8 / \sqrt{64}} = \frac{-2}{5.8 / 8} = \frac{-2}{0.725} \approx -2.7586 $$ 14. Determine the critical value and make a decision
Since it's a one-tailed test with $\alpha = 0.05$ and $df = n - 1 = 64 - 1 = 63$, we look up the critical t-value in a t-table. Since 63 is not on the table, we will use 60, $t_{0.05, 60} \approx -1.671$. Since our calculated t-value (-2.7586) is less than the critical t-value (-1.671), we reject the null hypothesis.
- State the conclusion
We reject the null hypothesis. There is sufficient evidence to conclude that the average lifespan of the mice on the specified diet is less than 40 months at a 5% significance level.
- Problem 5: State the null and alternative hypotheses
Null hypothesis ($H_0$): $\mu = 10$ liters Alternative hypothesis ($H_1$): $\mu \neq 10$ liters (two-tailed test)
- Calculate the sample mean and standard deviation
Given data: 10.2, 9.7, 10.1, 10.3, 10.1, 9.8, 9.9, 10.4, 10.3, 9.8
$$ \bar{x} = \frac{10.2 + 9.7 + 10.1 + 10.3 + 10.1 + 9.8 + 9.9 + 10.4 + 10.3 + 9.8}{10} = \frac{100.6}{10} = 10.06 $$
$$ s = \sqrt{\frac{\sum_{i=1}^{n}(x_i - \bar{x})^2}{n-1}} $$
$$ s = \sqrt{\frac{(10.2-10.06)^2 + (9.7-10.06)^2 + (10.1-10.06)^2 + (10.3-10.06)^2 + (10.1-10.06)^2 + (9.8-10.06)^2 + (9.9-10.06)^2 + (10.4-10.06)^2 + (10.3-10.06)^2 + (9.8-10.06)^2}{10-1}} $$
$$ s = \sqrt{\frac{0.0196 + 0.1296 + 0.0016 + 0.0576 + 0.0016 + 0.0676 + 0.0256 + 0.1156 + 0.0576 + 0.0676}{9}} $$
$$ s = \sqrt{\frac{0.544}{9}} \approx \sqrt{0.06044} \approx 0.2459 $$ 18. Calculate the test statistic
$$ t = \frac{\bar{x} - \mu_0}{s / \sqrt{n}} = \frac{10.06 - 10}{0.2459 / \sqrt{10}} = \frac{0.06}{0.2459 / 3.1623} \approx \frac{0.06}{0.07776} \approx 0.7716 $$
- Determine the critical value and make a decision
Since it's a two-tailed test with $\alpha = 0.01$ and $df = n - 1 = 10 - 1 = 9$, we look up the critical t-value in a t-table for $\alpha/2 = 0.005$. We find $t_{0.005, 9} \approx \pm 3.250$. Since our calculated t-value (0.7716) is between -3.250 and 3.250, we fail to reject the null hypothesis.
- State the conclusion
We fail to reject the null hypothesis. There isn't sufficient evidence to conclude that the manufacturer is wrong about the content of the oil containers at a 1% significance level.
- $9.7384 < \mu < 10.2616$
- a) $172.2264 < \mu < 176.7736$ b) Podemos afirmar con un 98% de confianza que el tamaño posible de nuestro error es de aproximadamente 2.2736.
- $0.97815 < \mu < 1.03305$
- Rechazamos la hipótesis nula. Existe evidencia suficiente para concluir que la vida media de los ratones con la dieta especificada es inferior a 40 meses con un nivel de significancia del 5%.
- No rechazamos la hipótesis nula. No hay suficiente evidencia para concluir que el fabricante se equivoca sobre el contenido de los envases de aceite con un nivel de significancia del 1%.
More Information
Confidence intervals provide a range within which the true population mean is likely to fall, given a certain level of confidence. Hypothesis testing allows us to make inferences about population parameters based on sample data, helping us to accept or reject specific claims.
Tips
- Using the z-table when the sample size is small and the population standard deviation is unknown; the t-table should be used instead.
- Forgetting to divide alpha by 2 for two-tailed tests when looking up critical values.
- Incorrectly calculating the degrees of freedom.
- Making errors when calculating the sample mean and standard deviation.
AI-generated content may contain errors. Please verify critical information