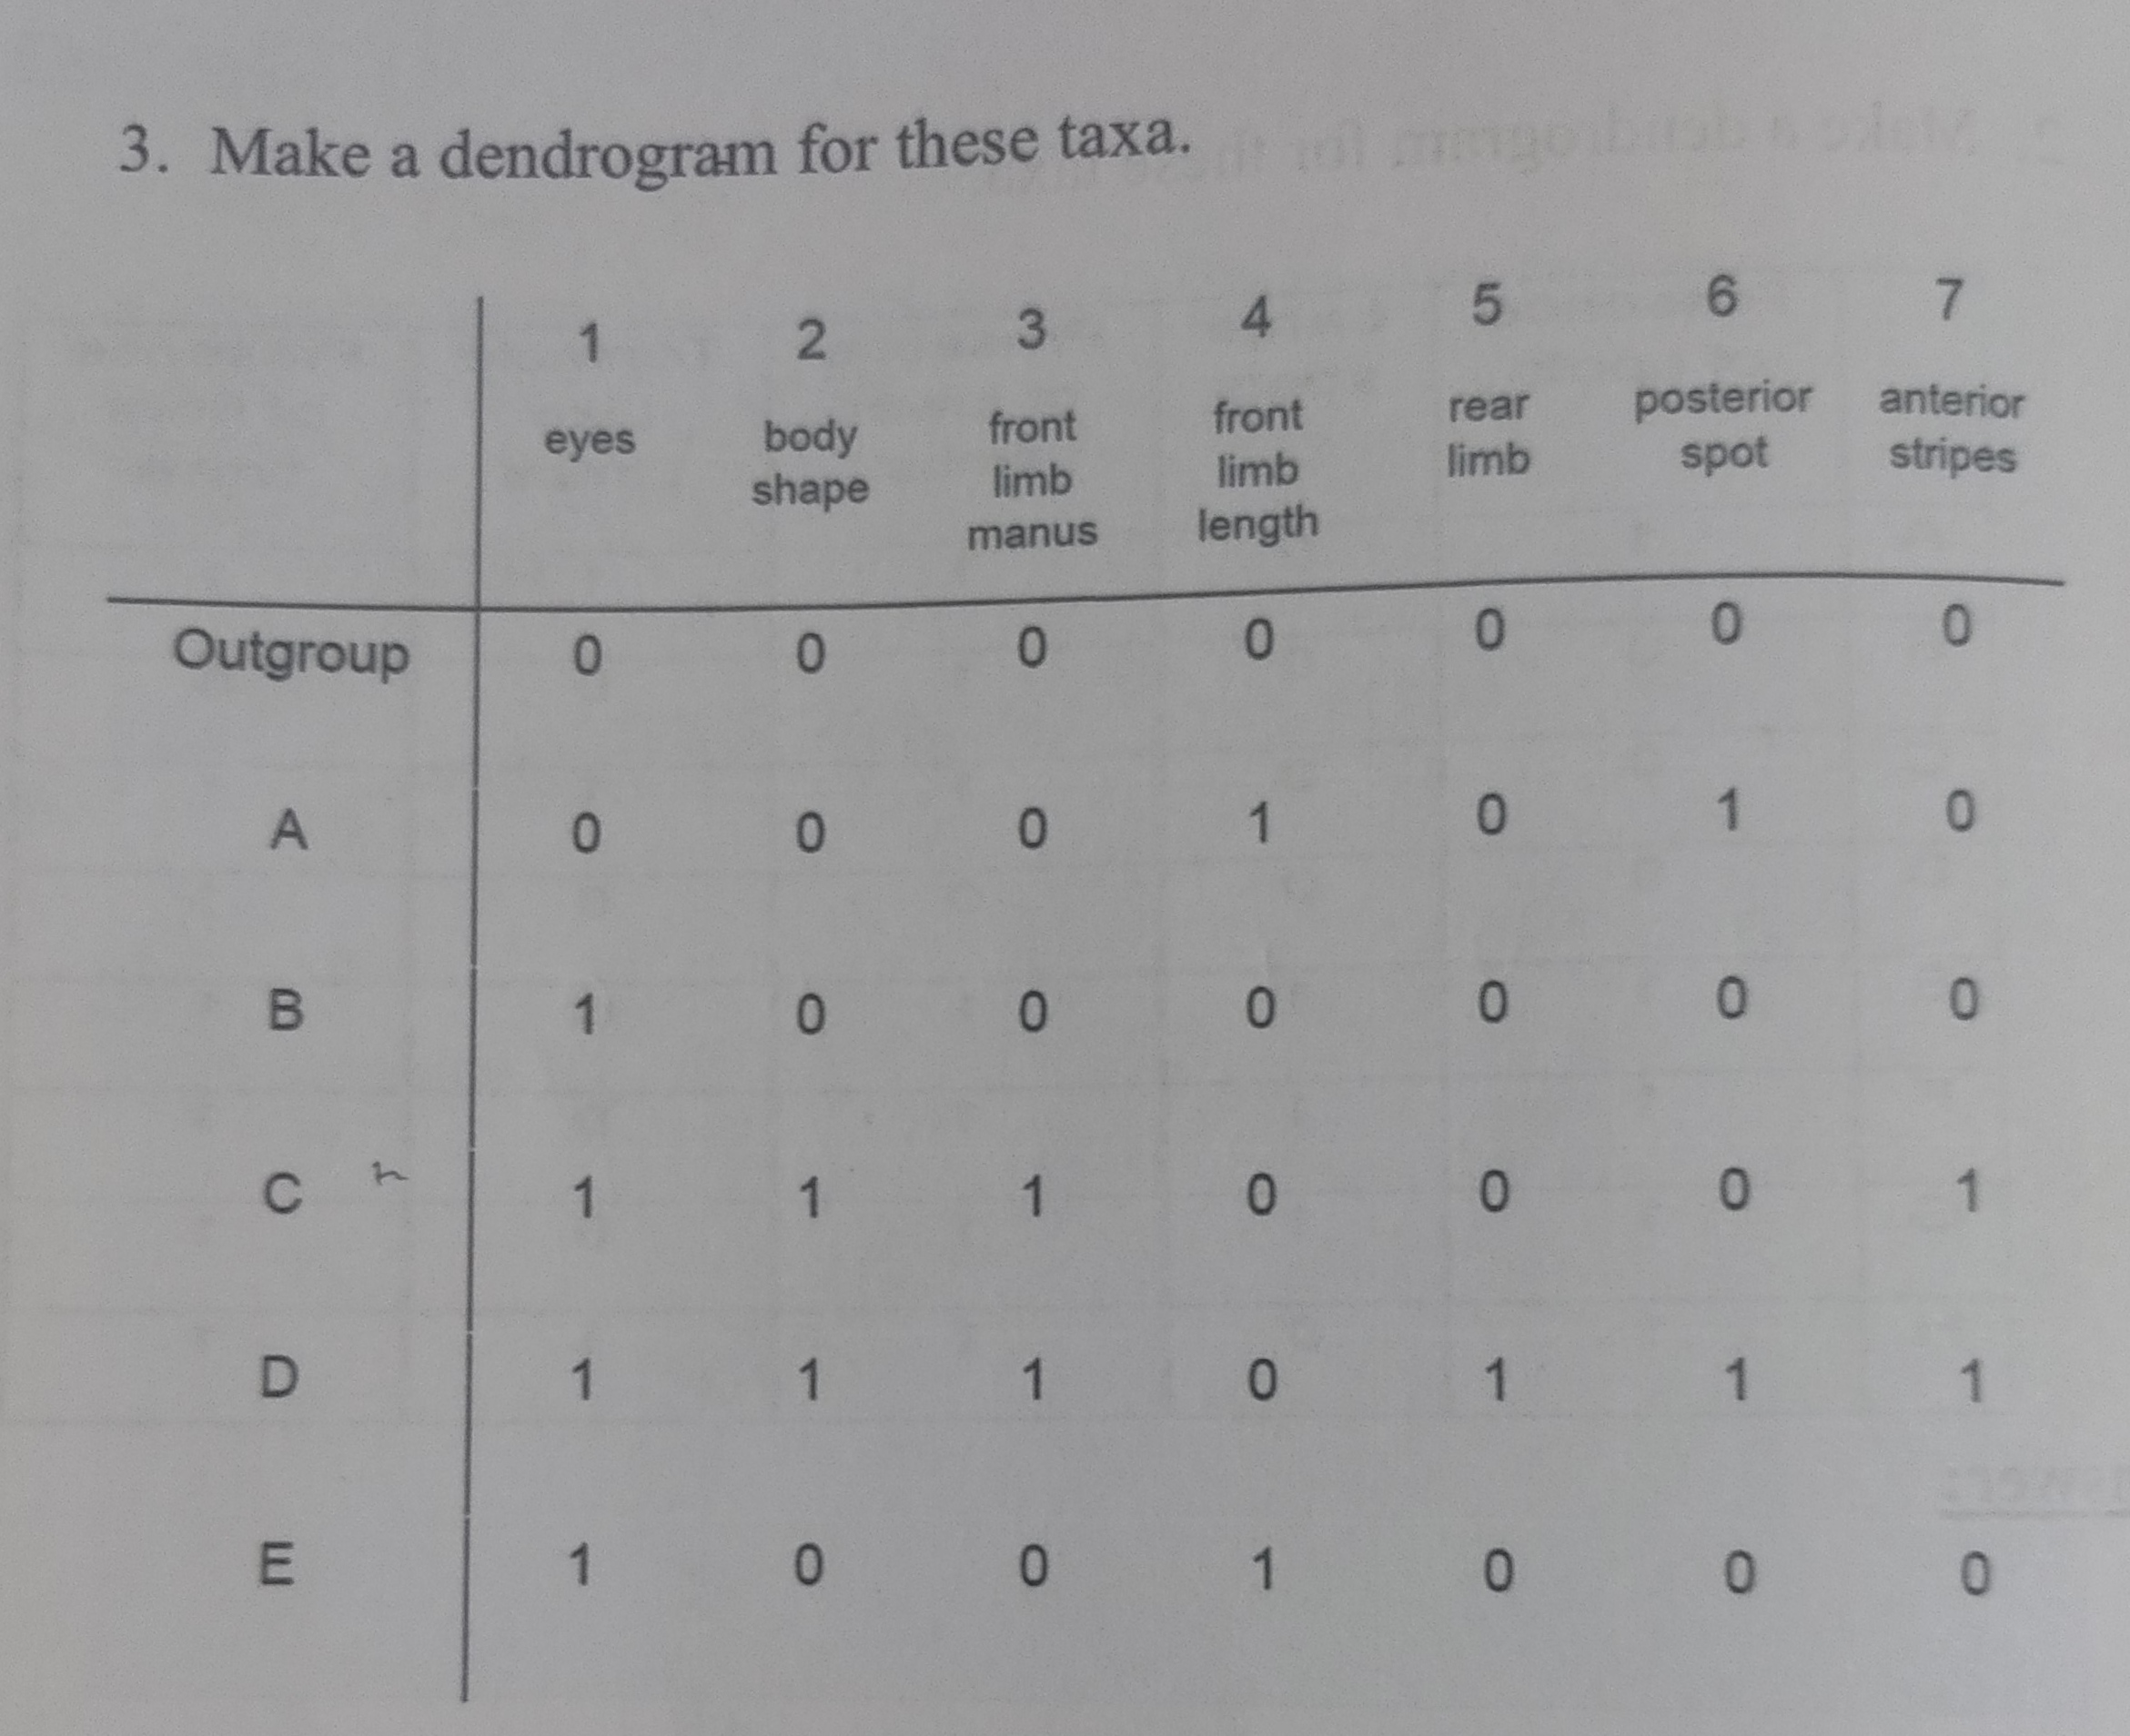
Make a dendrogram for these taxa.

Understand the Problem
The question is asking to construct a dendrogram, which is a tree-like diagram, based on the given character matrix for different taxa. It requires interpreting the presence or absence of specific traits to determine the relationships among the taxa.
Answer
Perform hierarchical clustering and plot a dendrogram using the binary data.
To create a dendrogram for the given taxa, perform hierarchical clustering using binary data and plot the resulting tree, emphasizing taxonomic similarities based on the matrices.
Answer for screen readers
To create a dendrogram for the given taxa, perform hierarchical clustering using binary data and plot the resulting tree, emphasizing taxonomic similarities based on the matrices.
More Information
Dendrograms are a popular method for visualizing the relationships between entities based on certain characteristics, useful in bioinformatics for visualizing evolutionary relationships.
Tips
A common mistake is using inappropriate distance metrics; ensure they match the data type.
Sources
- Plot Hierarchical Clustering Dendrogram - Scikit-learn - scikit-learn.org
- Dendrogram - Wikipedia - en.wikipedia.org
- Dendrograms in R, a lightweight approach - atrebas.github.io
AI-generated content may contain errors. Please verify critical information