Let y = 2x. Let L = maths. How do I interpret the table and graph?
Understand the Problem
The question involves interpreting a graph or a table related to a mathematical function, possibly involving calculations or analysis of the data presented.
Answer
The data suggests a pattern of exponential growth, likely modeled by $y = ab^x$.
Answer for screen readers
The data appears to fit the pattern of an exponential growth function due to the rapidly increasing values of $y$. The specific function can be modeled based on the data.
Steps to Solve
-
Understanding the Table Data
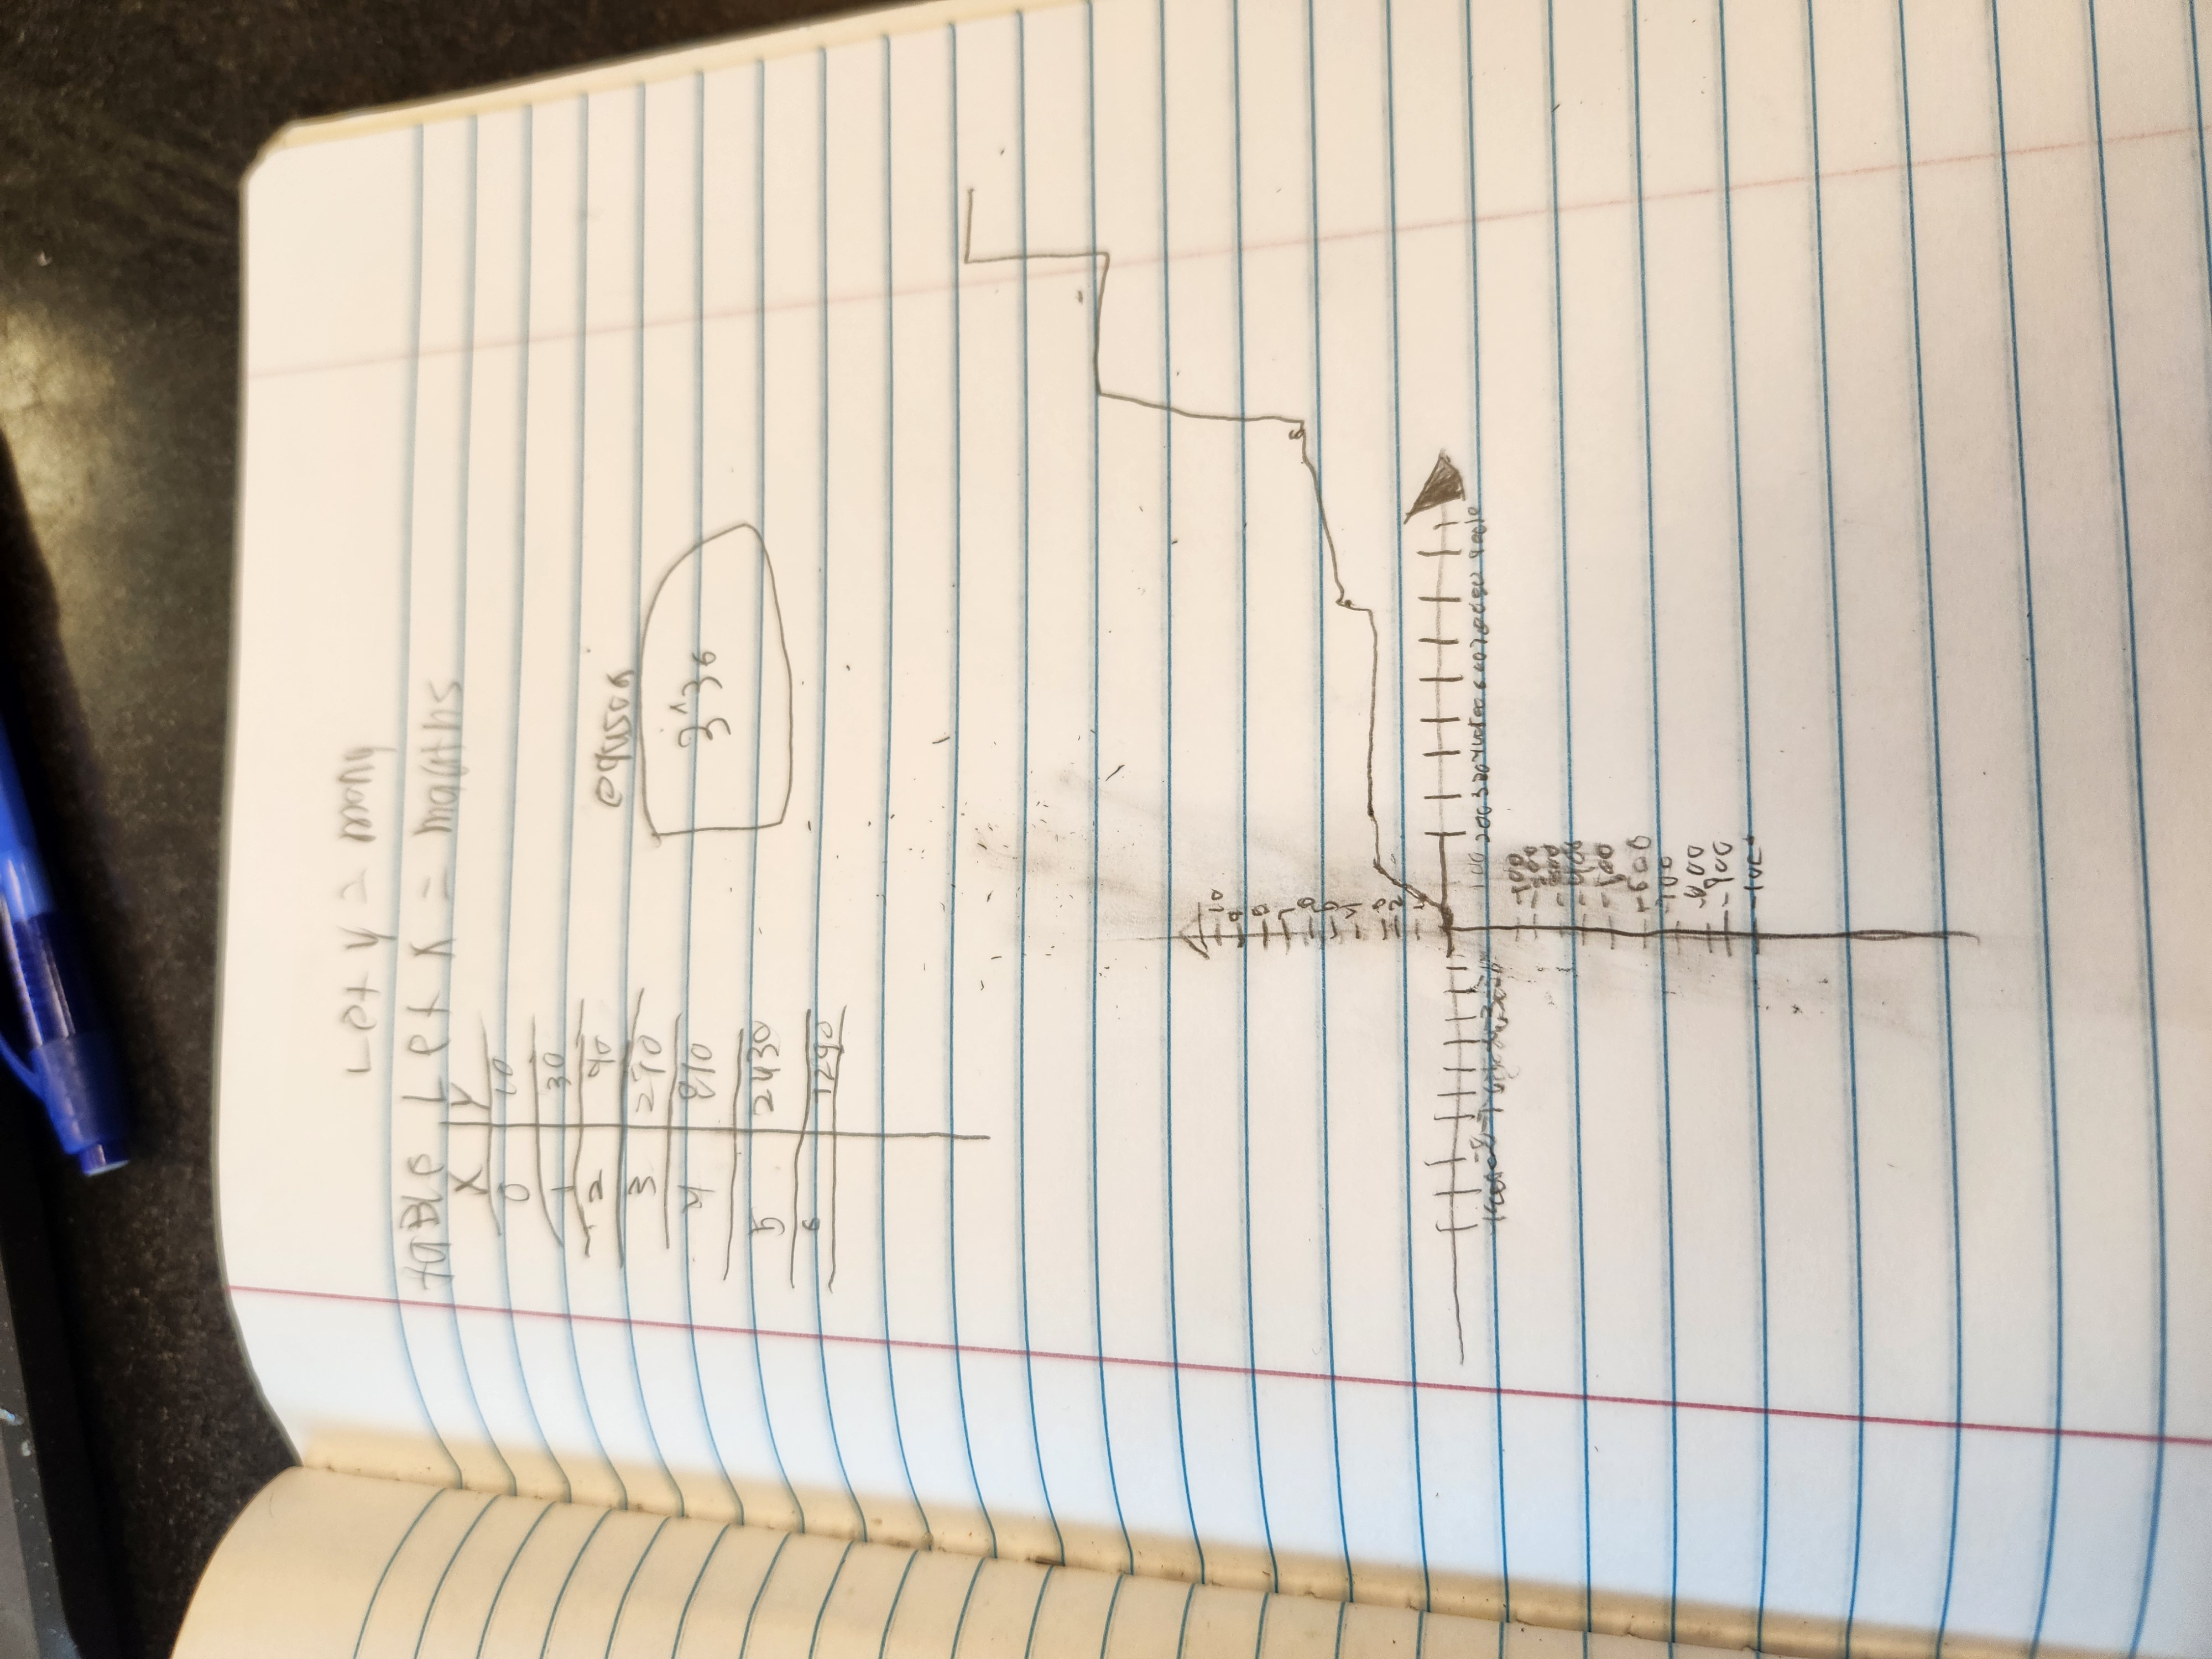
The table presents a relationship between two variables, $x$ (the first column) and $y$ (the second column). Each row corresponds to a pair of values $(x, y)$. -
Extracting the Data Points
The data points from the table are as follows:- $(0, 0)$
- $(1, 30)$
- $(2, 70)$
- $(3, 120)$
- $(4, 270)$
- $(5, 910)$
- $(6, 2430)$
- $(7, 1290)$
-
Identifying Patterns
Check how $y$ changes with respect to $x$. You can look for a possible function or relationship. Notice that the values of $y$ grow rapidly, suggesting an exponential or polynomial relationship. -
Plotting the Points
Graph the data points on a coordinate system to visualize the relationship. -
Analyzing Growth
To find a pattern, consider calculating ratios of consecutive $y$ values or the differences to see if there's a consistent growth rate. -
Finding a Function
Based on the rapid increase, let's hypothesize a function. Given the nature of the values, check if a polynomial regression fits the data well.
The data appears to fit the pattern of an exponential growth function due to the rapidly increasing values of $y$. The specific function can be modeled based on the data.
More Information
This type of data is common in growth scenarios, such as population studies or compound interest problems. The rapid increases indicate a possible exponential growth model, often defined by equations like $y = ab^x$ where $a$ is the starting value and $b$ is the growth factor.
Tips
- Ignoring the units of measurement, which can lead to confusion in interpreting the graph.
- Not looking for patterns in the rate of change, which may lead to the incorrect assumption about the type of function.
AI-generated content may contain errors. Please verify critical information