Understand the Problem
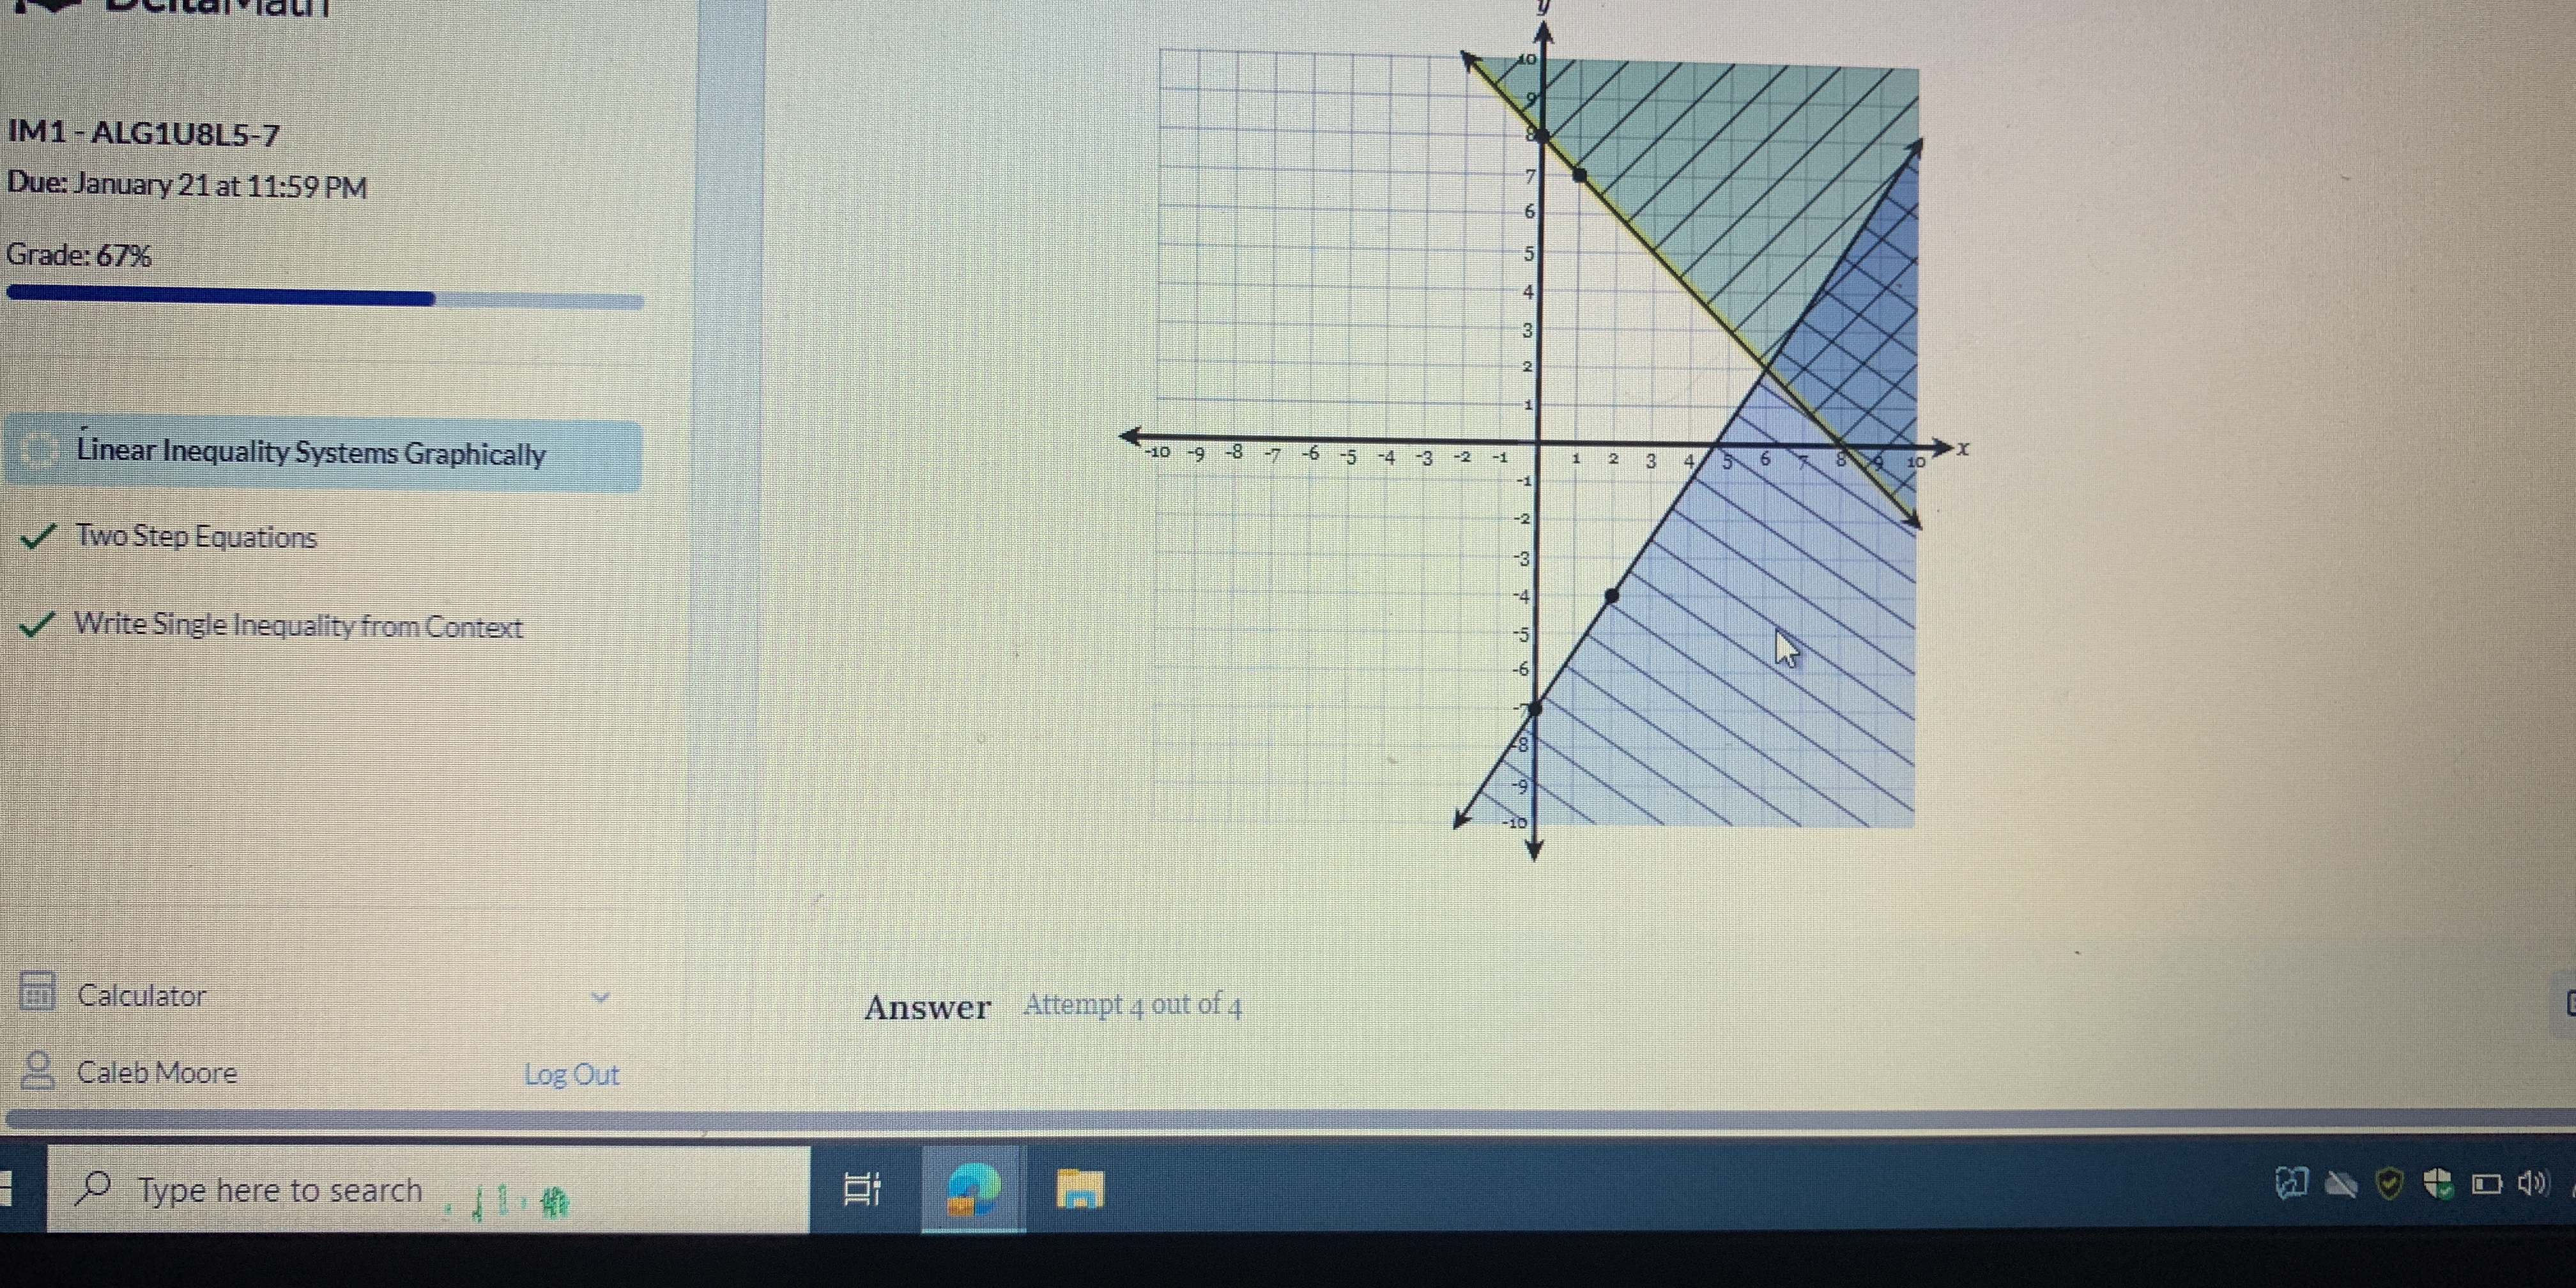
The question appears to be related to graphing linear inequalities. It likely involves determining the solution set from the graphical representation provided in the image. The user may be required to identify inequalities based on the shading of the regions or the lines presented in the graph.
Answer
The system of inequalities is given by $y < mx + b$ and $y > nx + c$.
Answer for screen readers
The system of inequalities represented in the graph can be expressed as:
$$ y < mx + b \quad \text{and} \quad y > nx + c $$
Steps to Solve
- Identify the lines from the graph
Look at the lines in the graph. The two lines divide the plane into regions. You need to find the equations of these lines.
- Determine the equations of the lines
For each line, find the slope (m) and the y-intercept (b).
For example, if the line crosses the y-axis at 2 and has a slope of 1:
$$ y = mx + b $$
can be written as:
$$ y = 1x + 2 $$
- Identify the inequality signs
Check the shading on the graph. If a region is shaded above a line, the inequality is $y > mx + b$. If below, use $y < mx + b$.
For instance, if the area above the first line is shaded, the inequality for that line is:
$$ y < mx + b $$
- Combine the inequalities
Once you have the inequalities for both lines, combine them. If the regions overlap, the solution must satisfy both inequalities.
For instance, if we have:
$$ y < mx + b \quad \text{and} \quad y > nx + c $$
Then the combined inequalities would be:
$$ n < y < mx + b $$
The system of inequalities represented in the graph can be expressed as:
$$ y < mx + b \quad \text{and} \quad y > nx + c $$
More Information
Graphing linear inequalities helps to visualize how the solution sets interact. The shaded regions often correspond to the solutions to the respective inequalities. Understanding how to derive these inequalities from the graphical representation is key in algebra.
Tips
- Failing to determine the correct direction of the inequality based on the shading.
- Confusing the slope and y-intercept or misreading their values from the graph.
- Not considering the combined region where the inequalities overlap.
AI-generated content may contain errors. Please verify critical information