If y varies directly with x, which graph represents the situation?
Understand the Problem
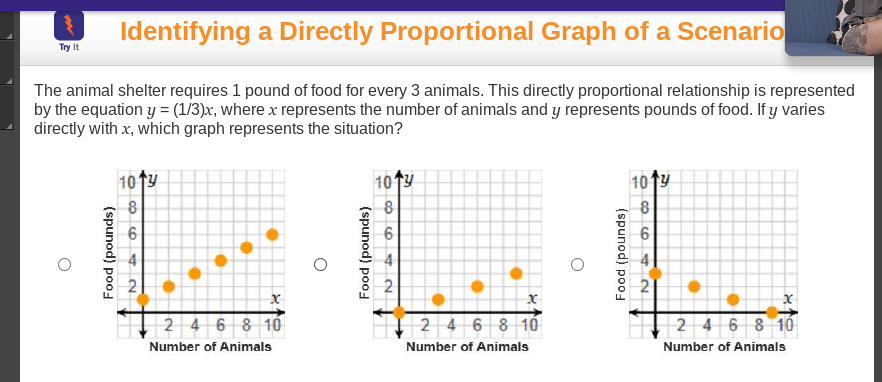
The question is asking to identify which graph correctly represents the direct proportional relationship given in the scenario about an animal shelter needing food. It provides an equation and asks which graph shows this relationship between the number of animals and the pounds of food required.
Answer
The correct graph is the one that shows a linear relationship starting from (0,0) and passing through (3,1), (6,2), and (9,3).
Answer for screen readers
The correct graph is the one that passes through the points (3, 1), (6, 2), and (9, 3) in a straight line.
Steps to Solve
- Understanding the equation
The equation given is $y = \frac{1}{3}x$. This means that for every 3 animals (x), the shelter requires 1 pound of food (y). Thus, food increases directly with the number of animals in a linear fashion.
- Identifying the direc proportionality
A direct proportionality shows a linear relationship where the line passes through the origin (0,0). Therefore, as the number of animals increases, the pounds of food will also increase proportionally.
- Calculating values for the equation
Let's calculate a few (x, y) pairs to exemplify the relationship:
- If $x = 3$, then $y = \frac{1}{3} \cdot 3 = 1$.
- If $x = 6$, then $y = \frac{1}{3} \cdot 6 = 2$.
- If $x = 9$, then $y = \frac{1}{3} \cdot 9 = 3$.
This means:
- For 3 animals, 1 pound of food is needed.
- For 6 animals, 2 pounds of food are needed.
- For 9 animals, 3 pounds of food are needed.
- Analyzing the graphs
Now we check which graph represents these calculated points:
- Look for points (3, 1), (6, 2), (9, 3).
- The graph should be a straight line starting from (0, 0) and passing through these points.
The correct graph is the one that passes through the points (3, 1), (6, 2), and (9, 3) in a straight line.
More Information
This relationship shows a linear increase in food demand as the number of animals increases. The slope of the line, which represents the rate of change, is $\frac{1}{3}$. This means for every increase of 3 animals, there is a corresponding increase of 1 pound of food.
Tips
- Not identifying the origin point: Some may forget that a directly proportional relationship begins at (0, 0). Ensure the line moves through this point.
- Misinterpreting the slope: It's crucial to recognize the slope as the rate of food required per number of animals.
AI-generated content may contain errors. Please verify critical information