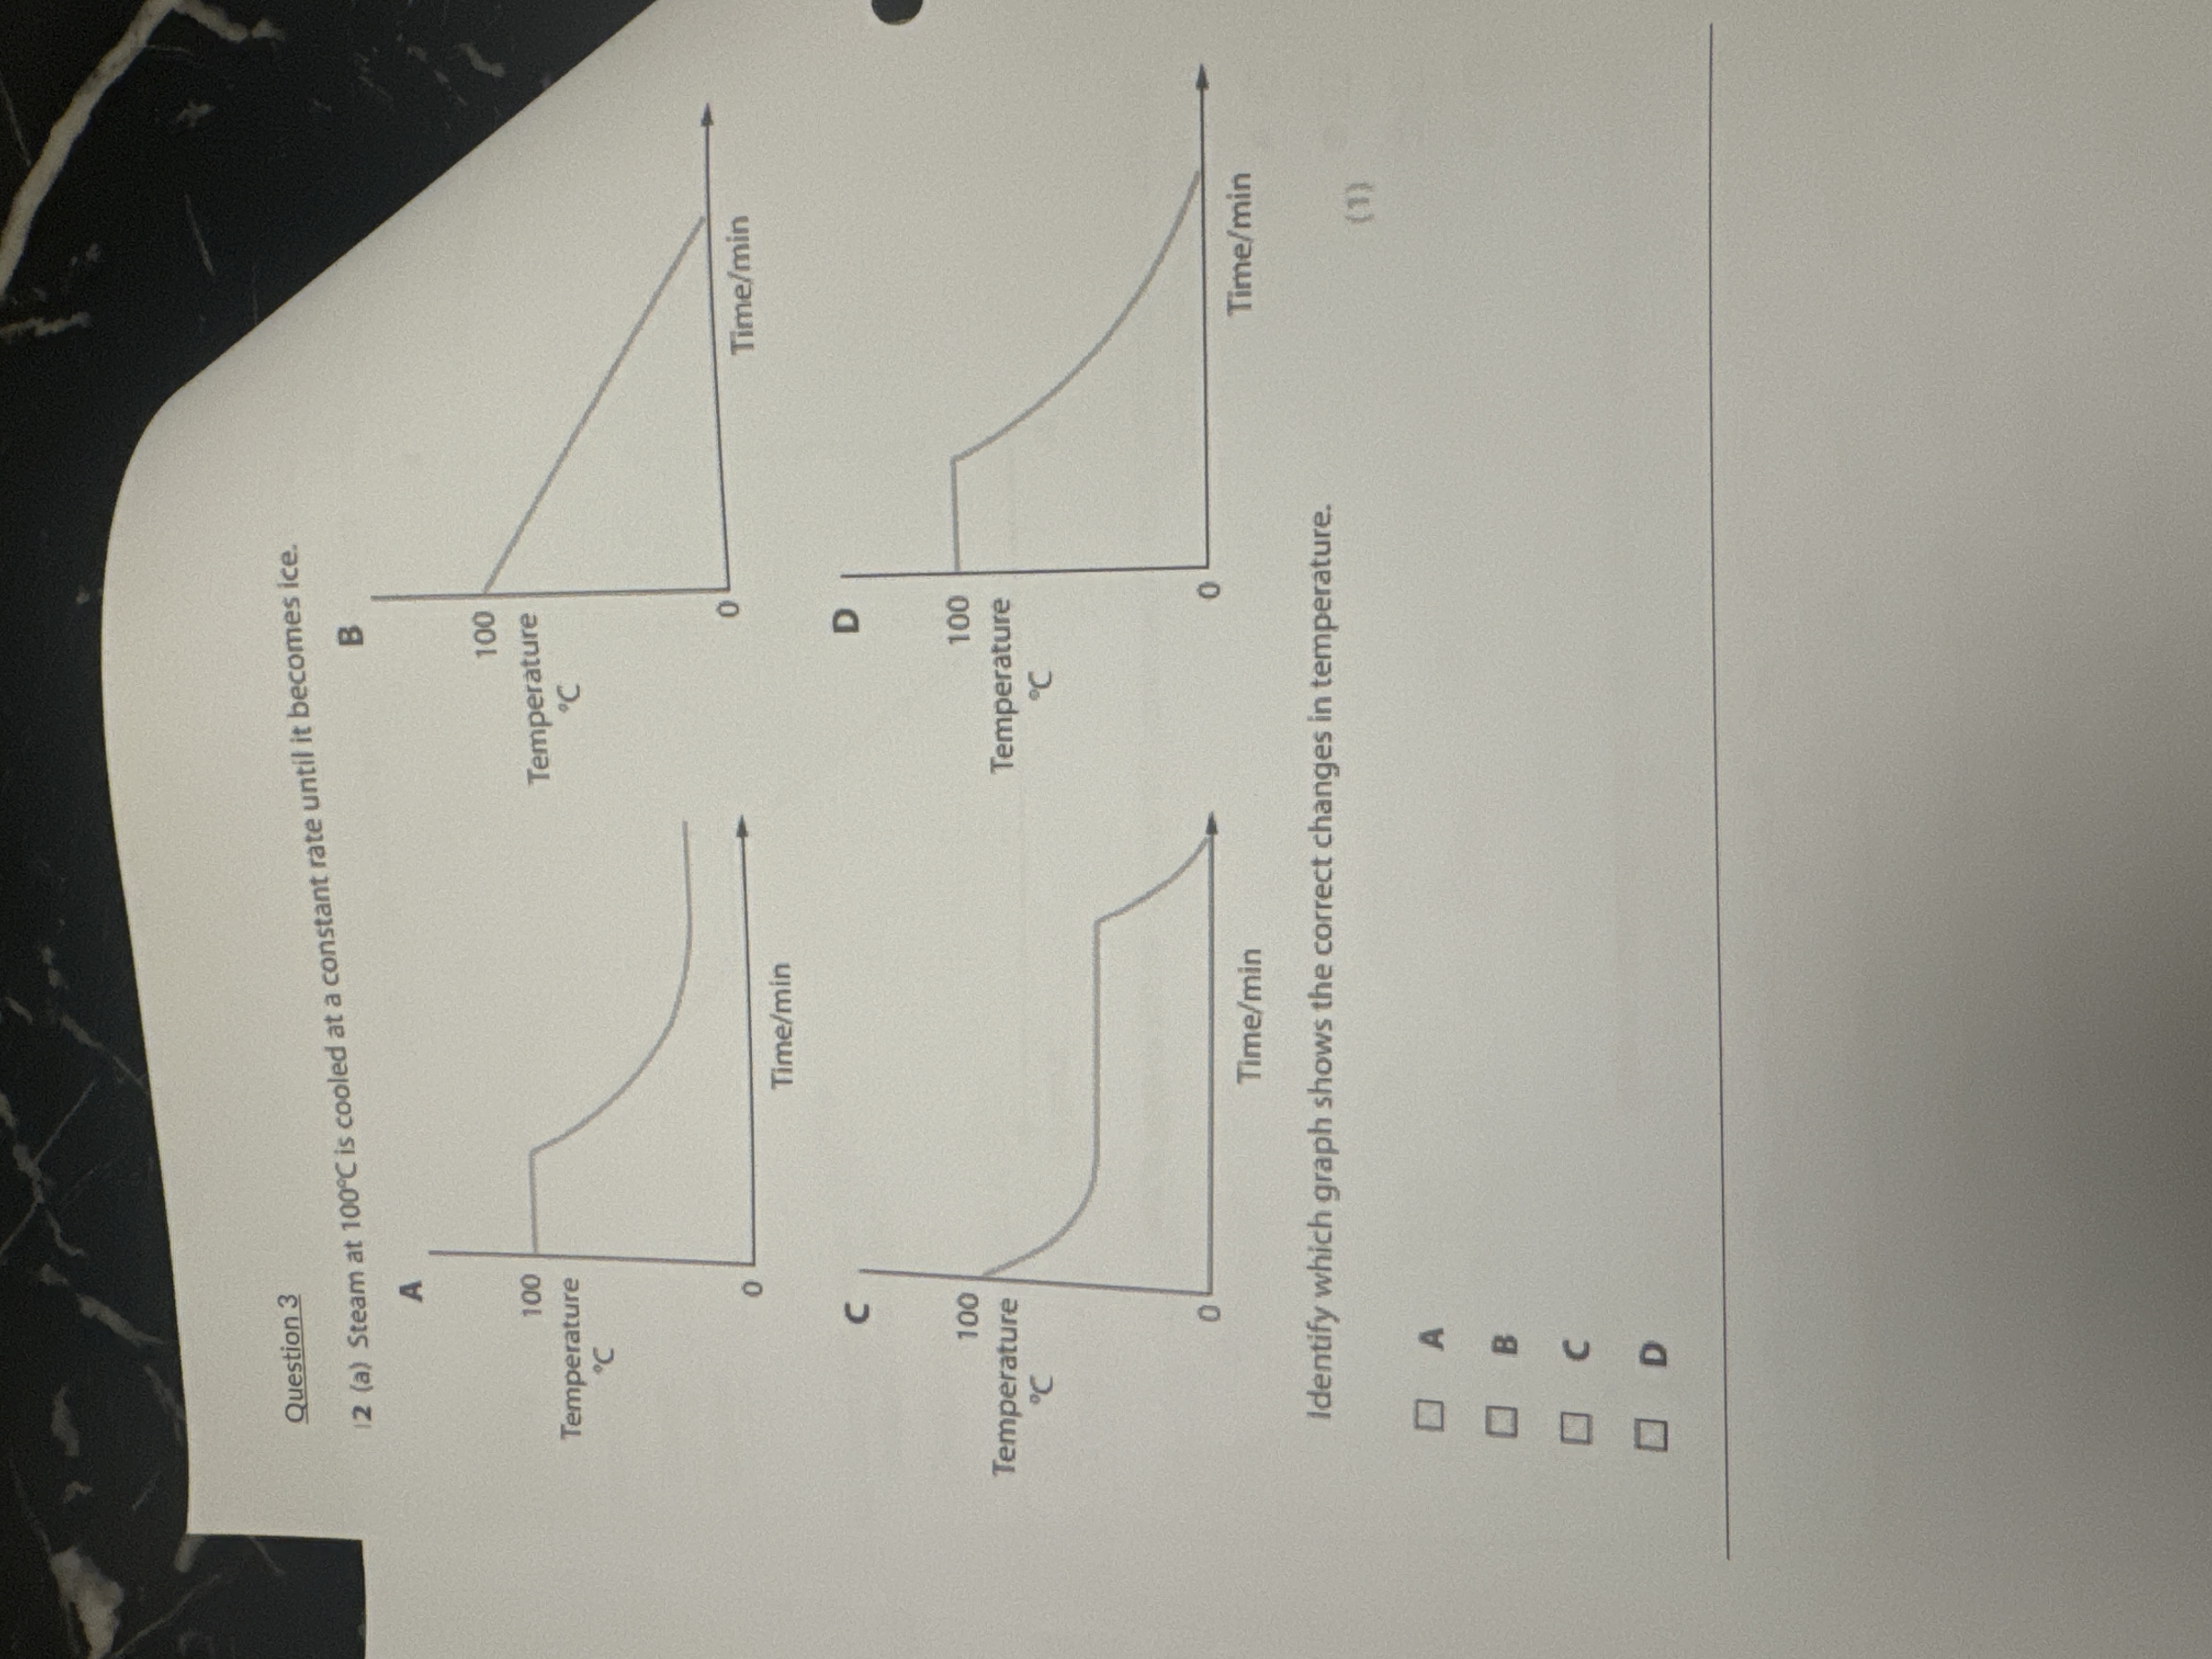
Identify which graph shows the correct changes in temperature.

Understand the Problem
The question is asking to identify which graph best represents the changes in temperature of steam as it cools at a constant rate until it becomes ice. This involves understanding phase changes and temperature changes in water.
Answer
Graph D
The correct graph is D.
Answer for screen readers
The correct graph is D.
More Information
As steam cools, it condenses to water at 100°C, then cools as a liquid, and eventually freezes to ice at 0°C. During the phase changes, temperature remains constant, shown by plateaus at these points.
Tips
A common mistake is not recognizing that temperature remains constant during phase changes.
AI-generated content may contain errors. Please verify critical information