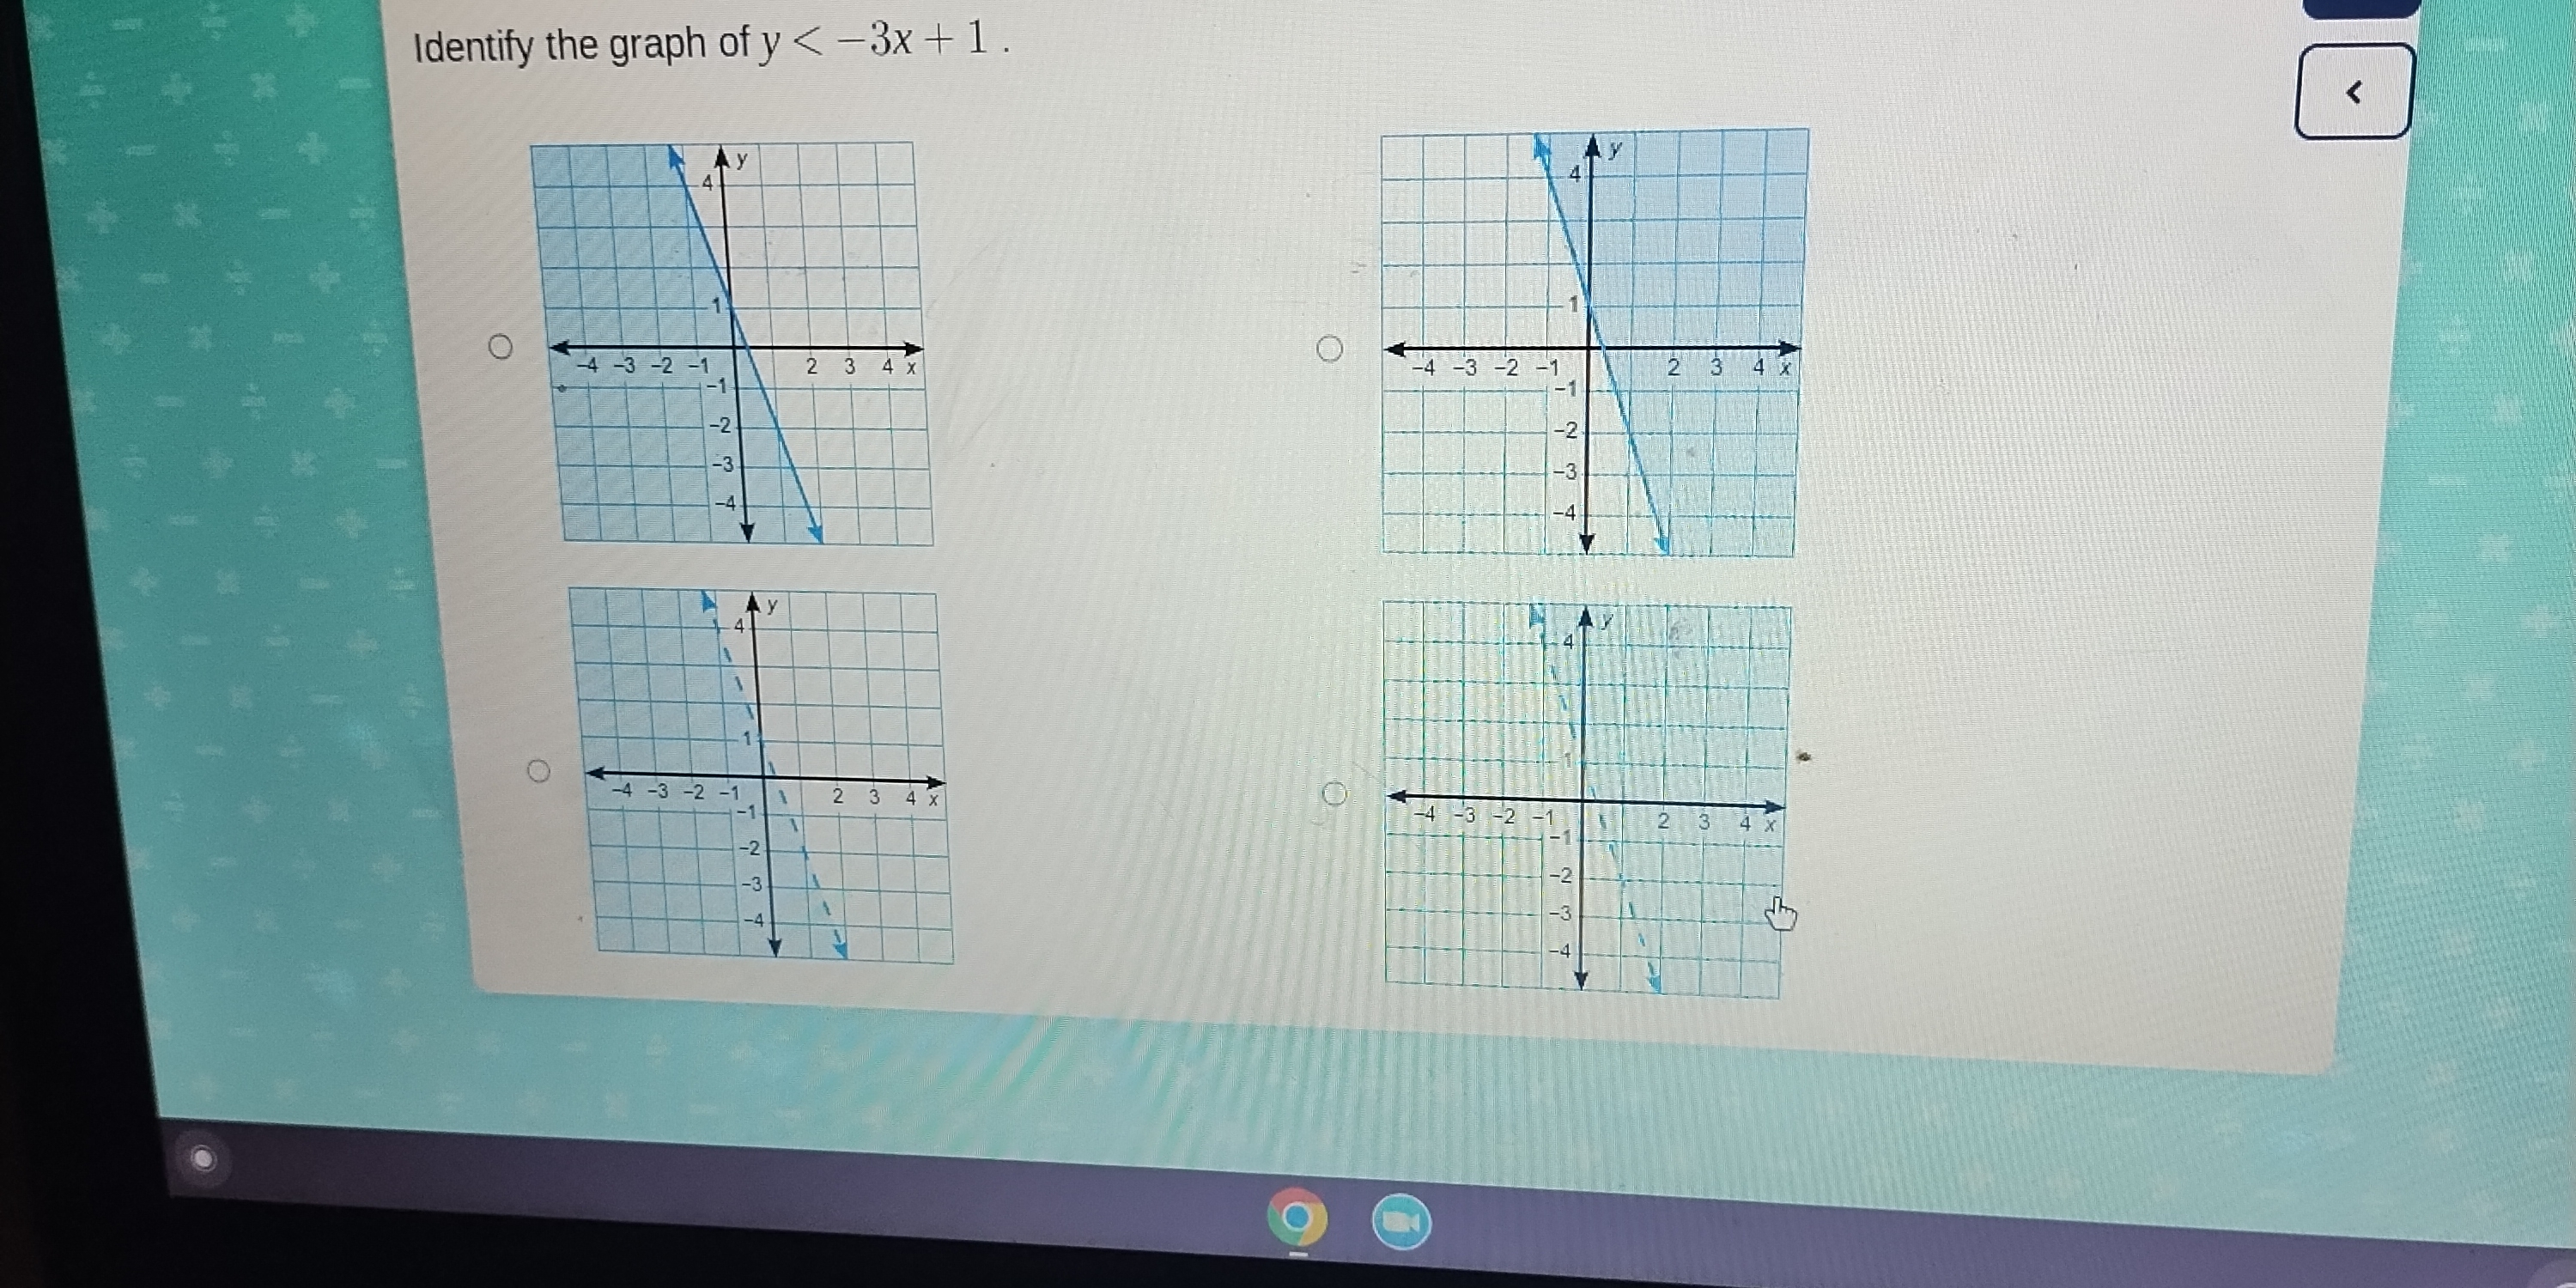
Identify the graph of y < -3x + 1.

Understand the Problem
The question is asking to identify which graph represents the inequality y < -3x + 1. This involves determining the appropriate graph that shows a line with a slope of -3 and a y-intercept at 1, with the area below this line shaded to represent the inequality.
Answer
The correct graph for the inequality $y < -3x + 1$ is the second graph (bottom-left).
Answer for screen readers
The correct graph that represents the inequality $y < -3x + 1$ is the second graph (bottom-left).
Steps to Solve
-
Identify the slope and y-intercept The given inequality is $y < -3x + 1$. From this, we can identify the slope $m = -3$ and the y-intercept $b = 1$.
-
Graph the line To graph the line $y = -3x + 1$, start at the y-intercept (0,1) on the y-axis. From this point, use the slope to find another point:
- The slope of -3 means that for every 1 unit you move to the right (positive x-direction), you move 3 units down (negative y-direction).
- From the point (0, 1), moving 1 unit right to (1, 0) results in another point.
-
Draw the line Draw a dashed line through the points (0, 1) and (1, 0). The dashed line indicates that points on the line are not included in the solution (as the inequality is strict).
-
Shade the correct region Since the inequality is $y < -3x + 1$, you need to shade the area below the line. This represents all the points where the y-values are less than the line.
-
Compare with the given graphs Look at the provided graphs and find the one that matches:
- A dashed line with a slope of -3 starting from (0, 1), shading the region below this line.
The correct graph that represents the inequality $y < -3x + 1$ is the second graph (bottom-left).
More Information
The slope of -3 indicates that the line decreases steeply. Each time you move to the right by 1 unit, the line falls by 3 units, creating a steep decline. The region below the line includes all the solutions to the inequality.
Tips
- Forgetting to use a dashed line: A common mistake is drawing a solid line, which indicates the points on the line are included in the solution (not applicable here).
- Incorrectly shading: It’s crucial to shade the region below the line when the inequality is “less than” (instead of above).
AI-generated content may contain errors. Please verify critical information