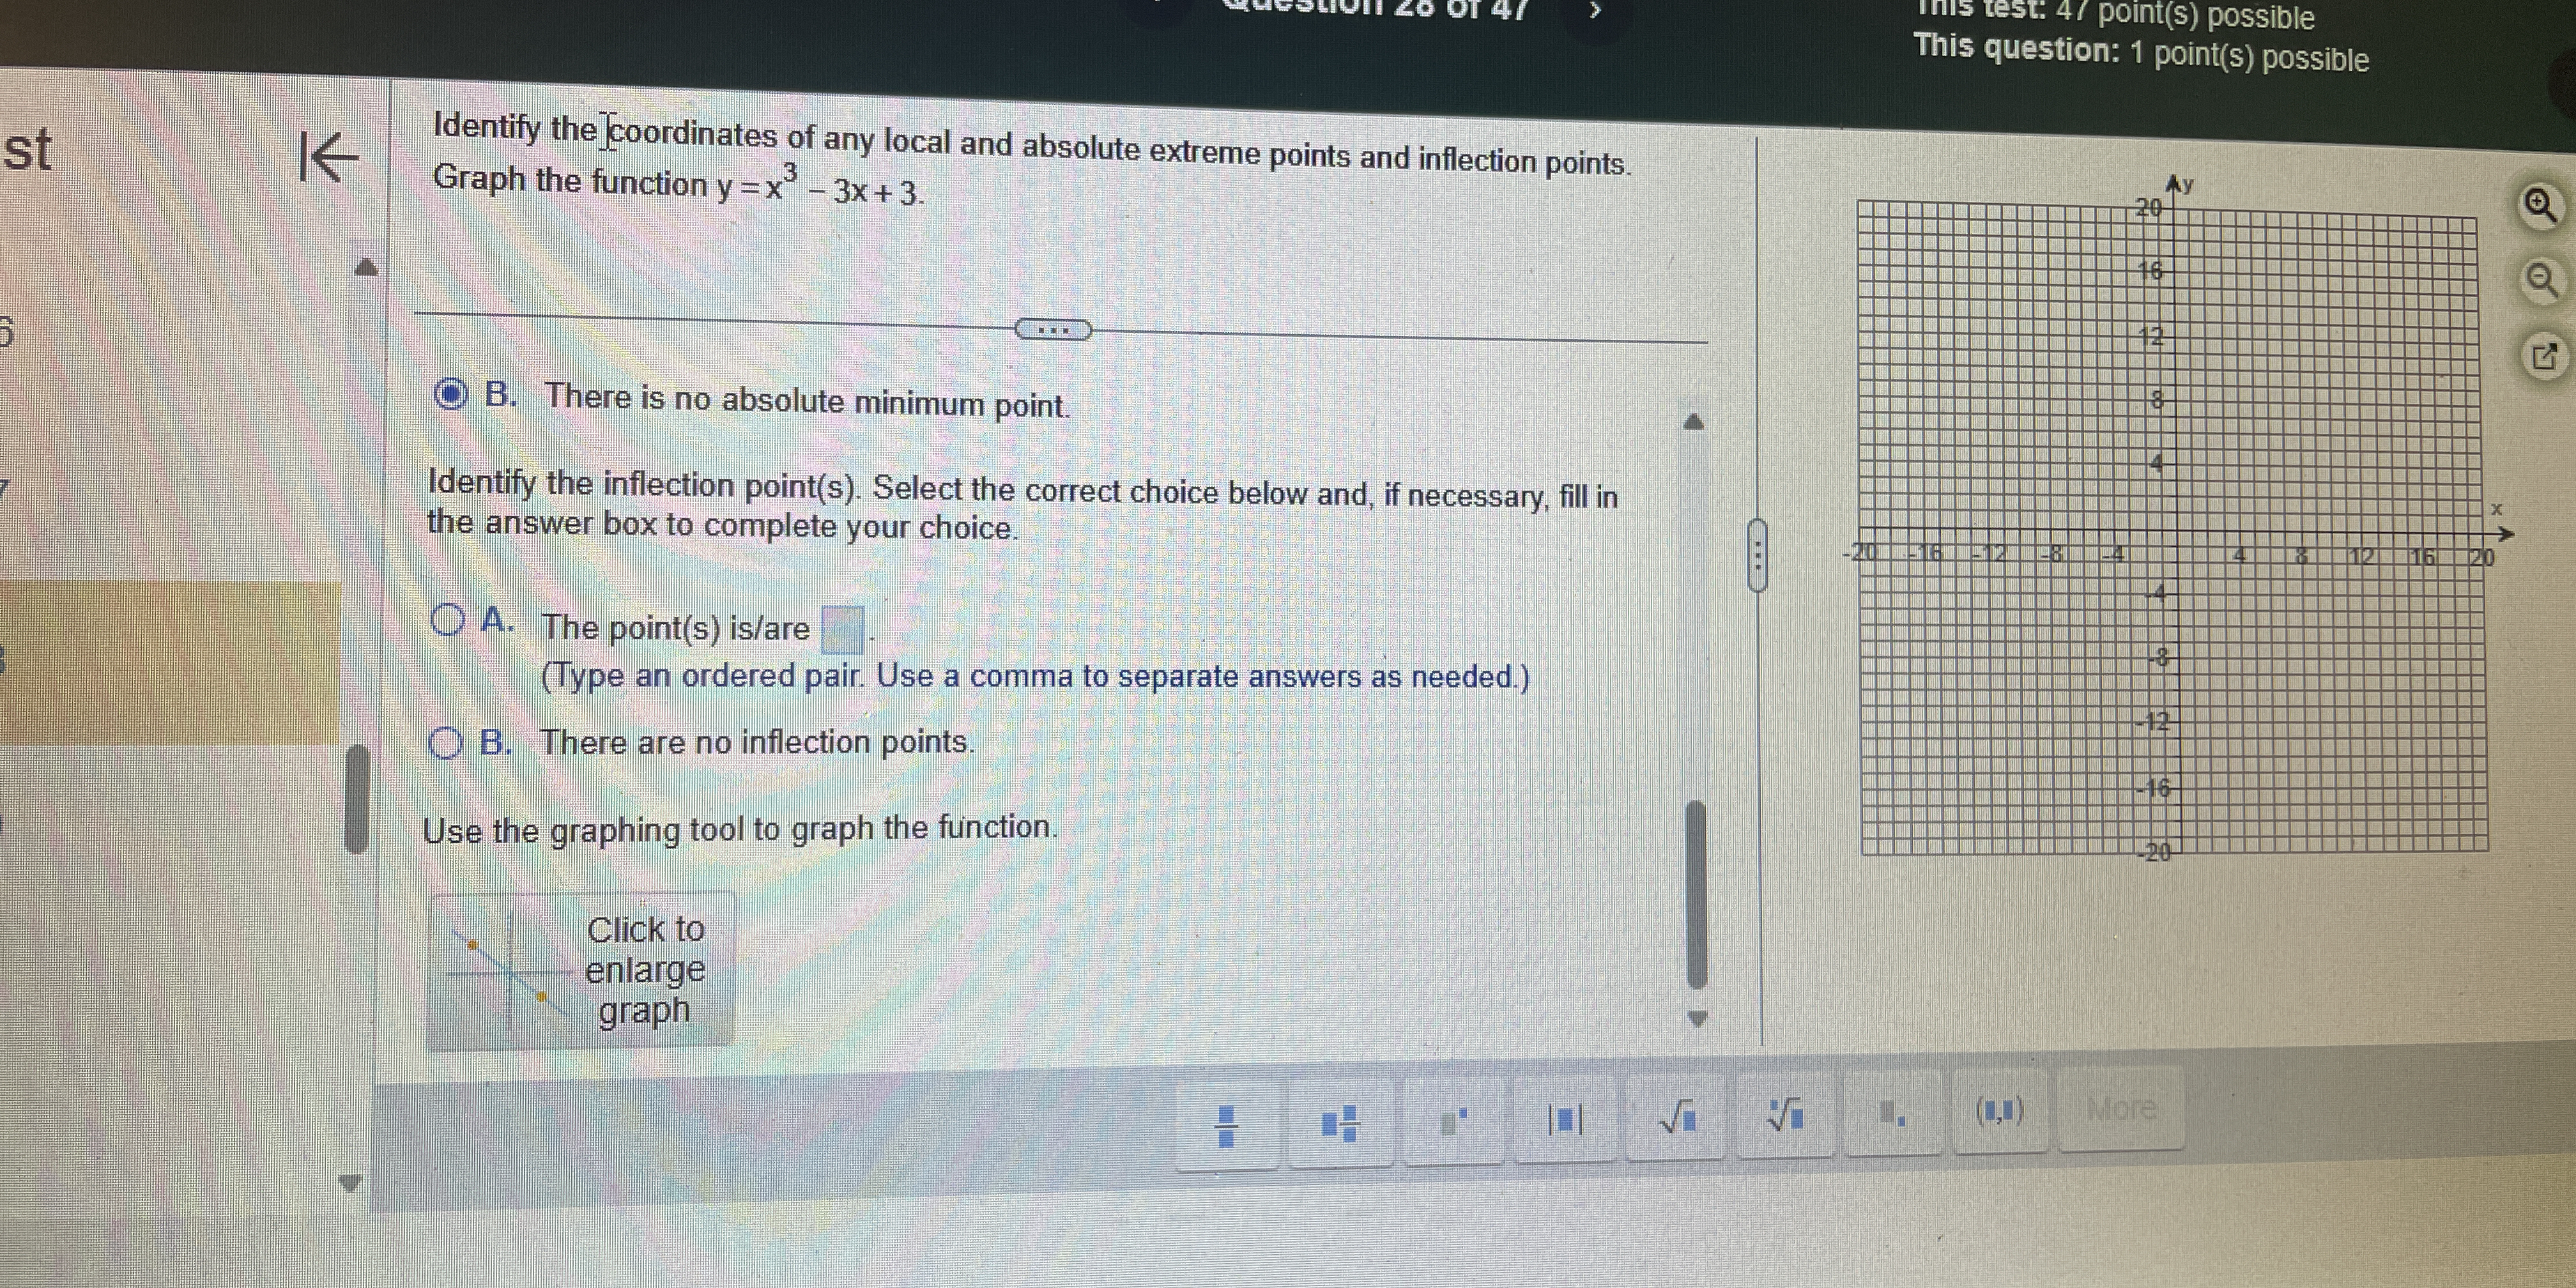
Identify the coordinates of any local and absolute extreme points and inflection points. Graph the function y = x^3 - 3x + 3.

Understand the Problem
The question is asking to identify the coordinates of local and absolute extreme points as well as inflection points for the function y = x^3 - 3x + 3, and to graph the function.
Answer
Local maximum: \( (-1, 5) \), Local minimum: \( (1, 1) \), Inflection point: \( (0, 3) \)
Answer for screen readers
- Local maximum: ( (-1, 5) )
- Local minimum: ( (1, 1) )
- Inflection point: ( (0, 3) )
Steps to Solve
- Find the first derivative
To locate local and absolute extreme points, we start by finding the first derivative of the function ( y = x^3 - 3x + 3 ):
[ y' = \frac{d}{dx}(x^3 - 3x + 3) = 3x^2 - 3 ]
- Set the first derivative to zero
Next, we set the first derivative equal to zero to find the critical points:
[ 3x^2 - 3 = 0 ]
Dividing by 3:
[ x^2 - 1 = 0 ]
Factoring the equation:
[ (x - 1)(x + 1) = 0 ]
Thus, the critical points are:
[ x = 1 \quad \text{and} \quad x = -1 ]
- Determine the second derivative
Now, for classification of the critical points, we'll find the second derivative:
[ y'' = \frac{d^2}{dx^2}(x^3 - 3x + 3) = 6x ]
- Evaluate the second derivative at critical points
We evaluate ( y'' ) at the critical points to determine their nature:
- For ( x = 1 ):
[ y''(1) = 6(1) = 6 \quad (\text{Local minimum}) ]
- For ( x = -1 ):
[ y''(-1) = 6(-1) = -6 \quad (\text{Local maximum}) ]
- Find the coordinates of the critical points
Now we find the ( y )-coordinates at the critical points:
- For ( x = 1 ):
[ y(1) = (1)^3 - 3(1) + 3 = 1 ]
- For ( x = -1 ):
[ y(-1) = (-1)^3 - 3(-1) + 3 = 5 ]
Thus, the local maximum is at ( (-1, 5) ) and the local minimum is at ( (1, 1) ).
- Find inflection points
To find inflection points, we set the second derivative equal to zero:
[ 6x = 0 \Rightarrow x = 0 ]
Evaluating ( y ) at ( x = 0 ):
[ y(0) = 0^3 - 3(0) + 3 = 3 ]
So, the inflection point is at ( (0, 3) ).
- Summarize points
- Local maximum: ( (-1, 5) )
- Local minimum: ( (1, 1) )
- Inflection point: ( (0, 3) )
- Graphing the function
Using graphing tools, we can visualize the function ( y = x^3 - 3x + 3 ) along with the identified points.
- Local maximum: ( (-1, 5) )
- Local minimum: ( (1, 1) )
- Inflection point: ( (0, 3) )
More Information
The function ( y = x^3 - 3x + 3 ) displays key characteristics such as a local maximum and minimum, along with an inflection point, indicating changes in concavity.
Tips
null
AI-generated content may contain errors. Please verify critical information