How many students were sampled?
Understand the Problem
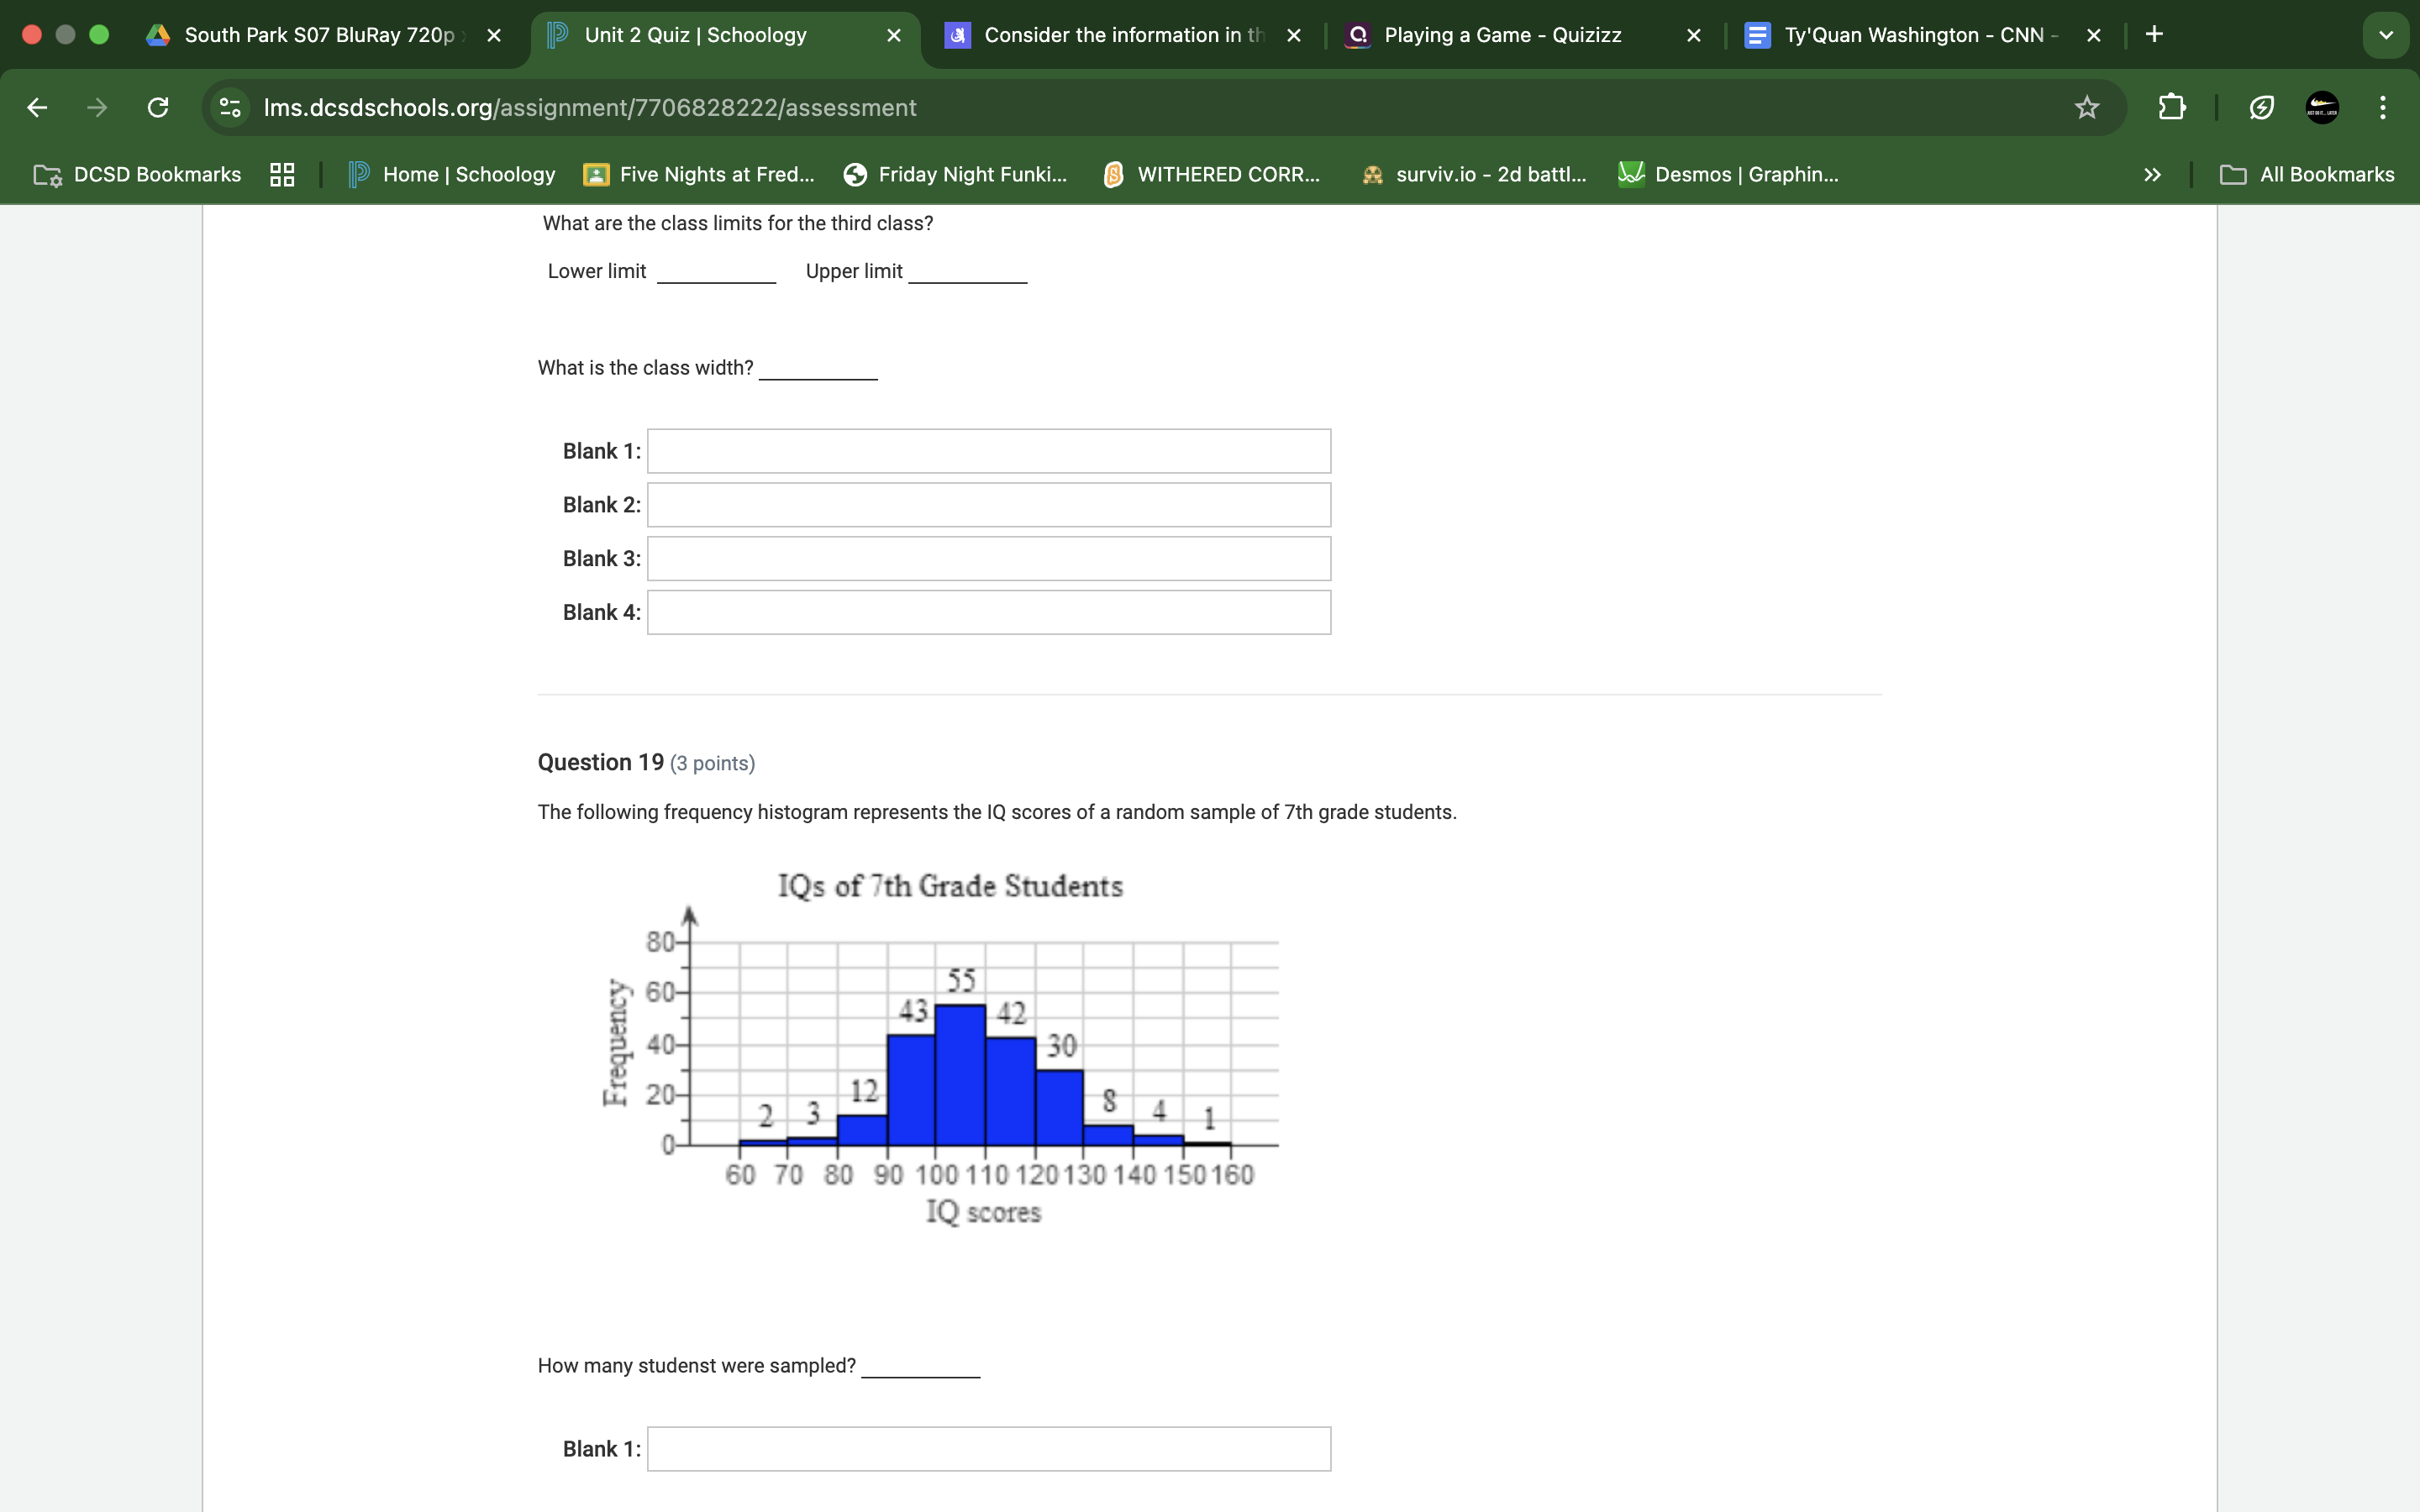
The question involves analyzing a histogram that represents IQ scores of 7th grade students. It asks for the total number of students sampled, which requires summing the frequencies from the histogram. Additionally, there are questions related to calculating class limits and class width, which involves understanding data grouping.
Answer
The total number of students sampled is $200$.
Answer for screen readers
The total number of students sampled is $200$.
Steps to Solve
- Identify the Frequencies Look at the histogram and note down the frequencies for each IQ score category. The frequencies are:
- 60-70: 2
- 70-80: 3
- 80-90: 12
- 90-100: 43
- 100-110: 55
- 110-120: 42
- 120-130: 30
- 130-140: 8
- 140-150: 4
- 150-160: 1
- Sum the Frequencies Add up all the frequencies to find the total number of students sampled.
$$ \text{Total} = 2 + 3 + 12 + 43 + 55 + 42 + 30 + 8 + 4 + 1 $$
- Calculate the Total Sum the values obtained:
$$ \text{Total} = 2 + 3 + 12 + 43 + 55 + 42 + 30 + 8 + 4 + 1 = 200 $$
The total number of students sampled is $200$.
More Information
This answer shows how to sum frequencies from a histogram to obtain the total sample size. Histograms provide a great visual representation of data distributions, and adding frequencies helps understand how many individuals are represented.
Tips
Some common mistakes include:
- Forgetting to include all frequency categories.
- Misreading frequency values from the histogram.
- Incorrectly adding frequencies (e.g., making simple arithmetic errors).
AI-generated content may contain errors. Please verify critical information