Understand the Problem
The question is related to graphing linear inequalities and interpreting their solutions visually on a coordinate plane.
Answer
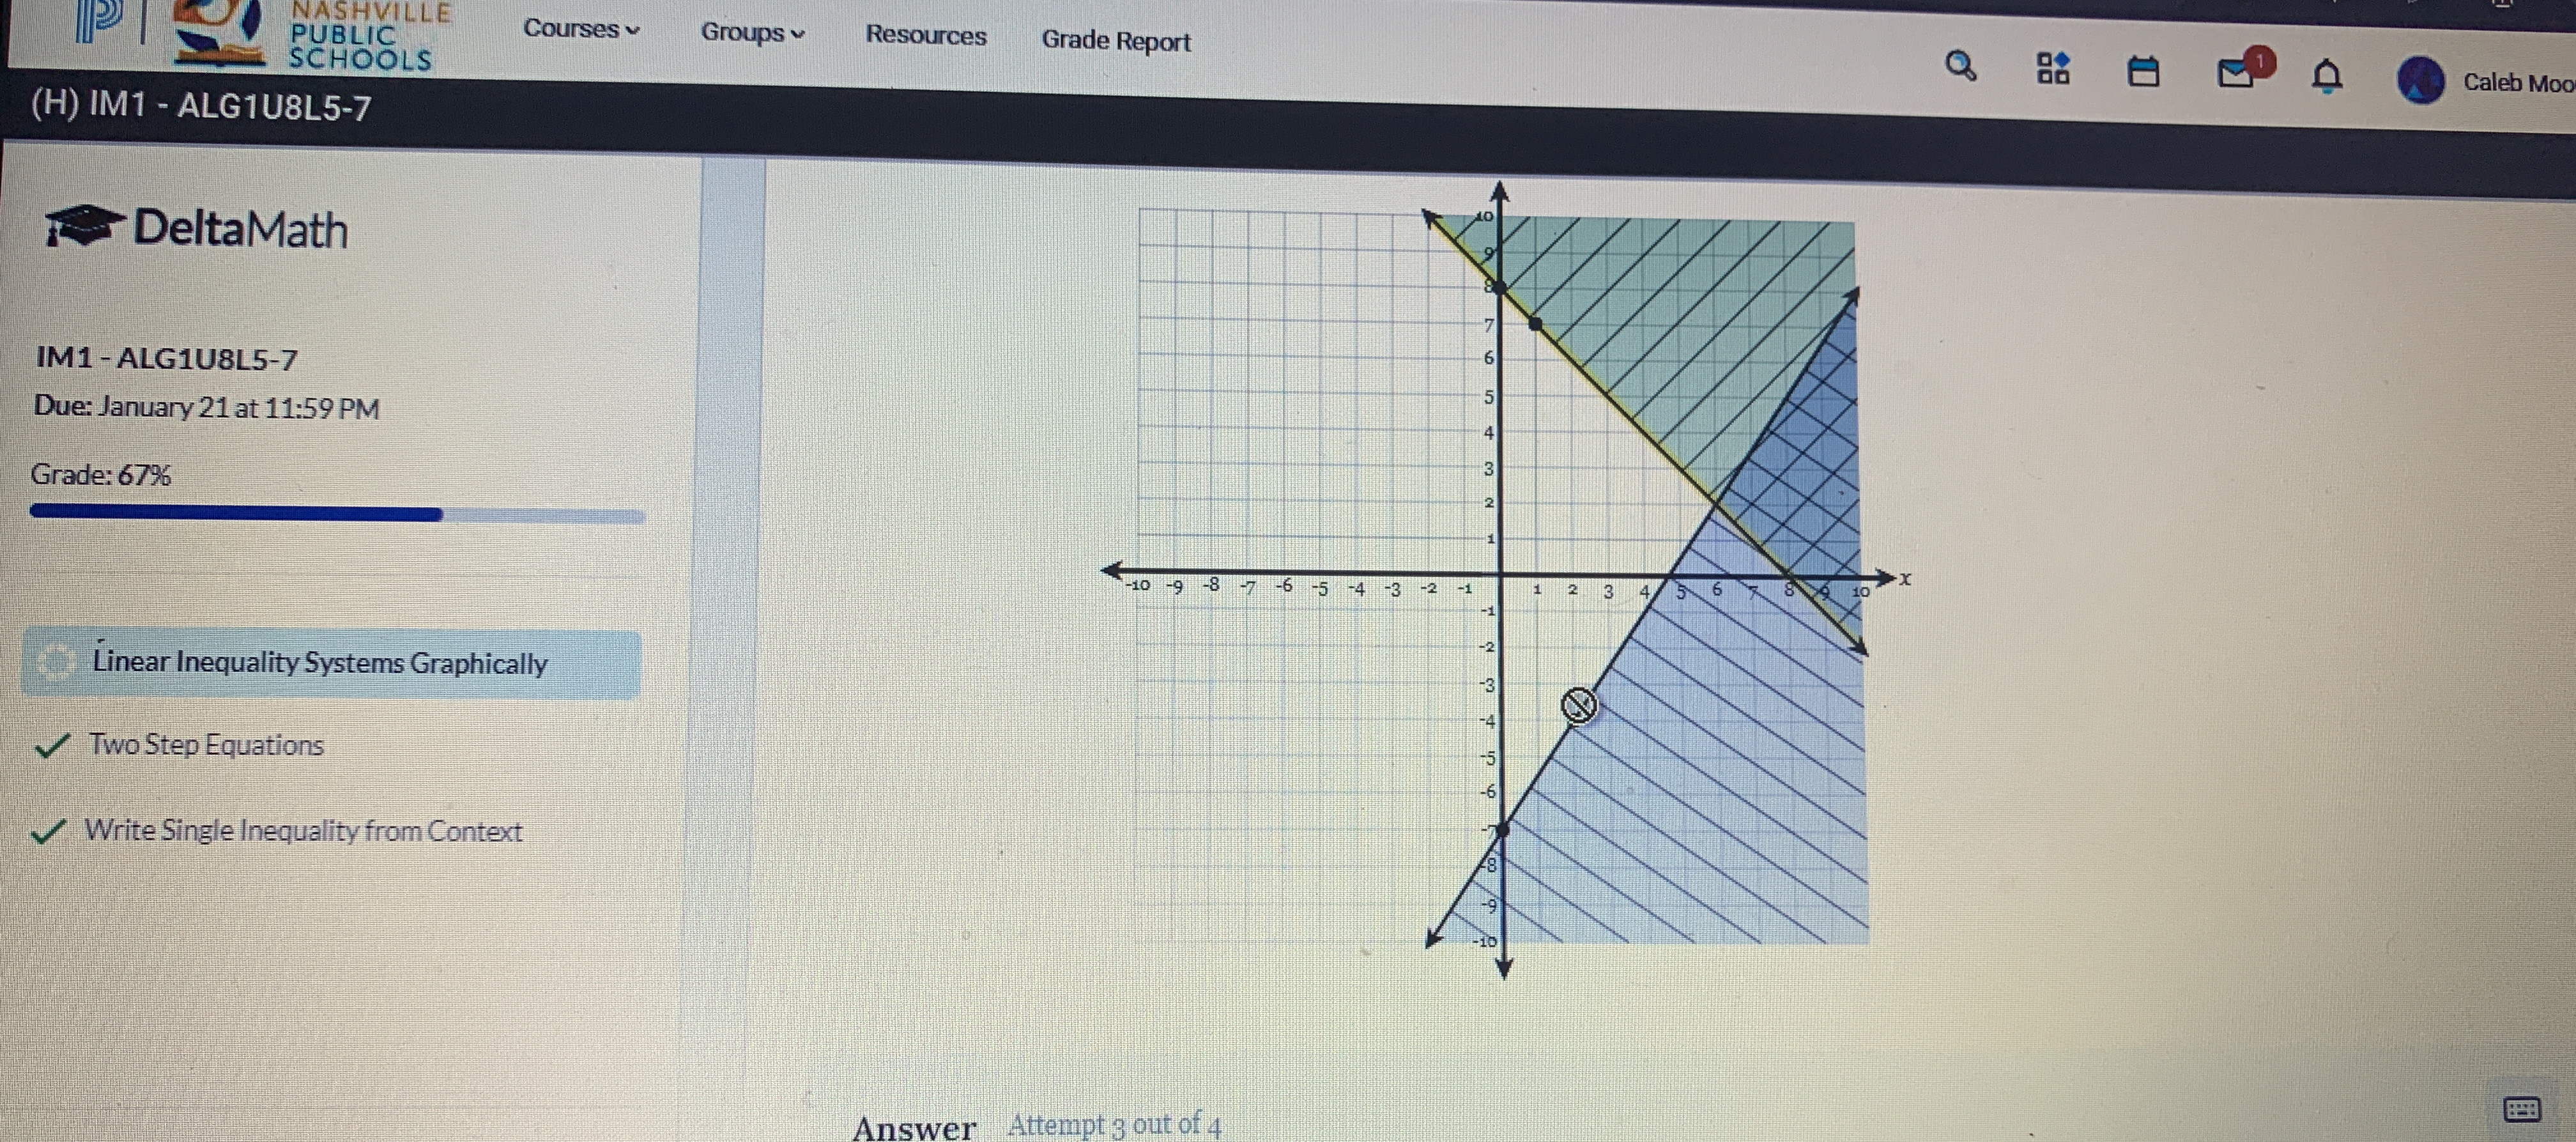
The system of inequalities is: $$ \begin{cases} y \leq -x + 9 \\ y \geq x - 3 \end{cases} $$
Answer for screen readers
The system of inequalities represented by the graph is: $$ \begin{cases} y \leq -x + 9 \ y \geq x - 3 \end{cases} $$
Steps to Solve
-
Identify the inequalities from the graph Examine the lines on the graph. Identify the boundaries of the shaded regions, which typically represent inequalities. The two lines appear to be:
- One line sloping downwards, indicating a 'less than' inequality.
- Another line sloping upwards, indicating a 'greater than' inequality.
-
Find the equations of the lines For each boundary line, determine the slope and the y-intercept to write the equations.
- The downward sloping line crosses the y-axis around (0, 9) and travels through (2, 7). Use these points to find the slope: $$ m = \frac{y_2 - y_1}{x_2 - x_1} = \frac{7 - 9}{2 - 0} = -1 $$ The equation can be written as: $$ y \leq -x + 9 $$
- The upward sloping line crosses the y-axis at approximately (0, -3) and through (5, 2). The slope is calculated as: $$ m = \frac{2 - (-3)}{5 - 0} = 1 $$ The equation is: $$ y \geq x - 3 $$
-
Combine the inequalities With both inequalities derived from their respective lines, express the system of inequalities: $$ \begin{cases} y \leq -x + 9 \ y \geq x - 3 \end{cases} $$
-
Determine the solution region The solution to this system is the area where the shaded regions overlap. This means you want to find points $(x, y)$ that satisfy both inequalities.
The system of inequalities represented by the graph is: $$ \begin{cases} y \leq -x + 9 \ y \geq x - 3 \end{cases} $$
More Information
This system shows the relationship between the two inequalities, indicating the conditions under which the solutions exist. The area of overlap is the set of solutions that satisfies both conditions visually represented on the graph.
Tips
- Not reversing the inequality sign when switching from the equation of a line to its corresponding inequality.
- Misidentifying the slope of the lines from the plotted points.
- Overlooking the shading direction, leading to incorrect representation of the solution region.
AI-generated content may contain errors. Please verify critical information