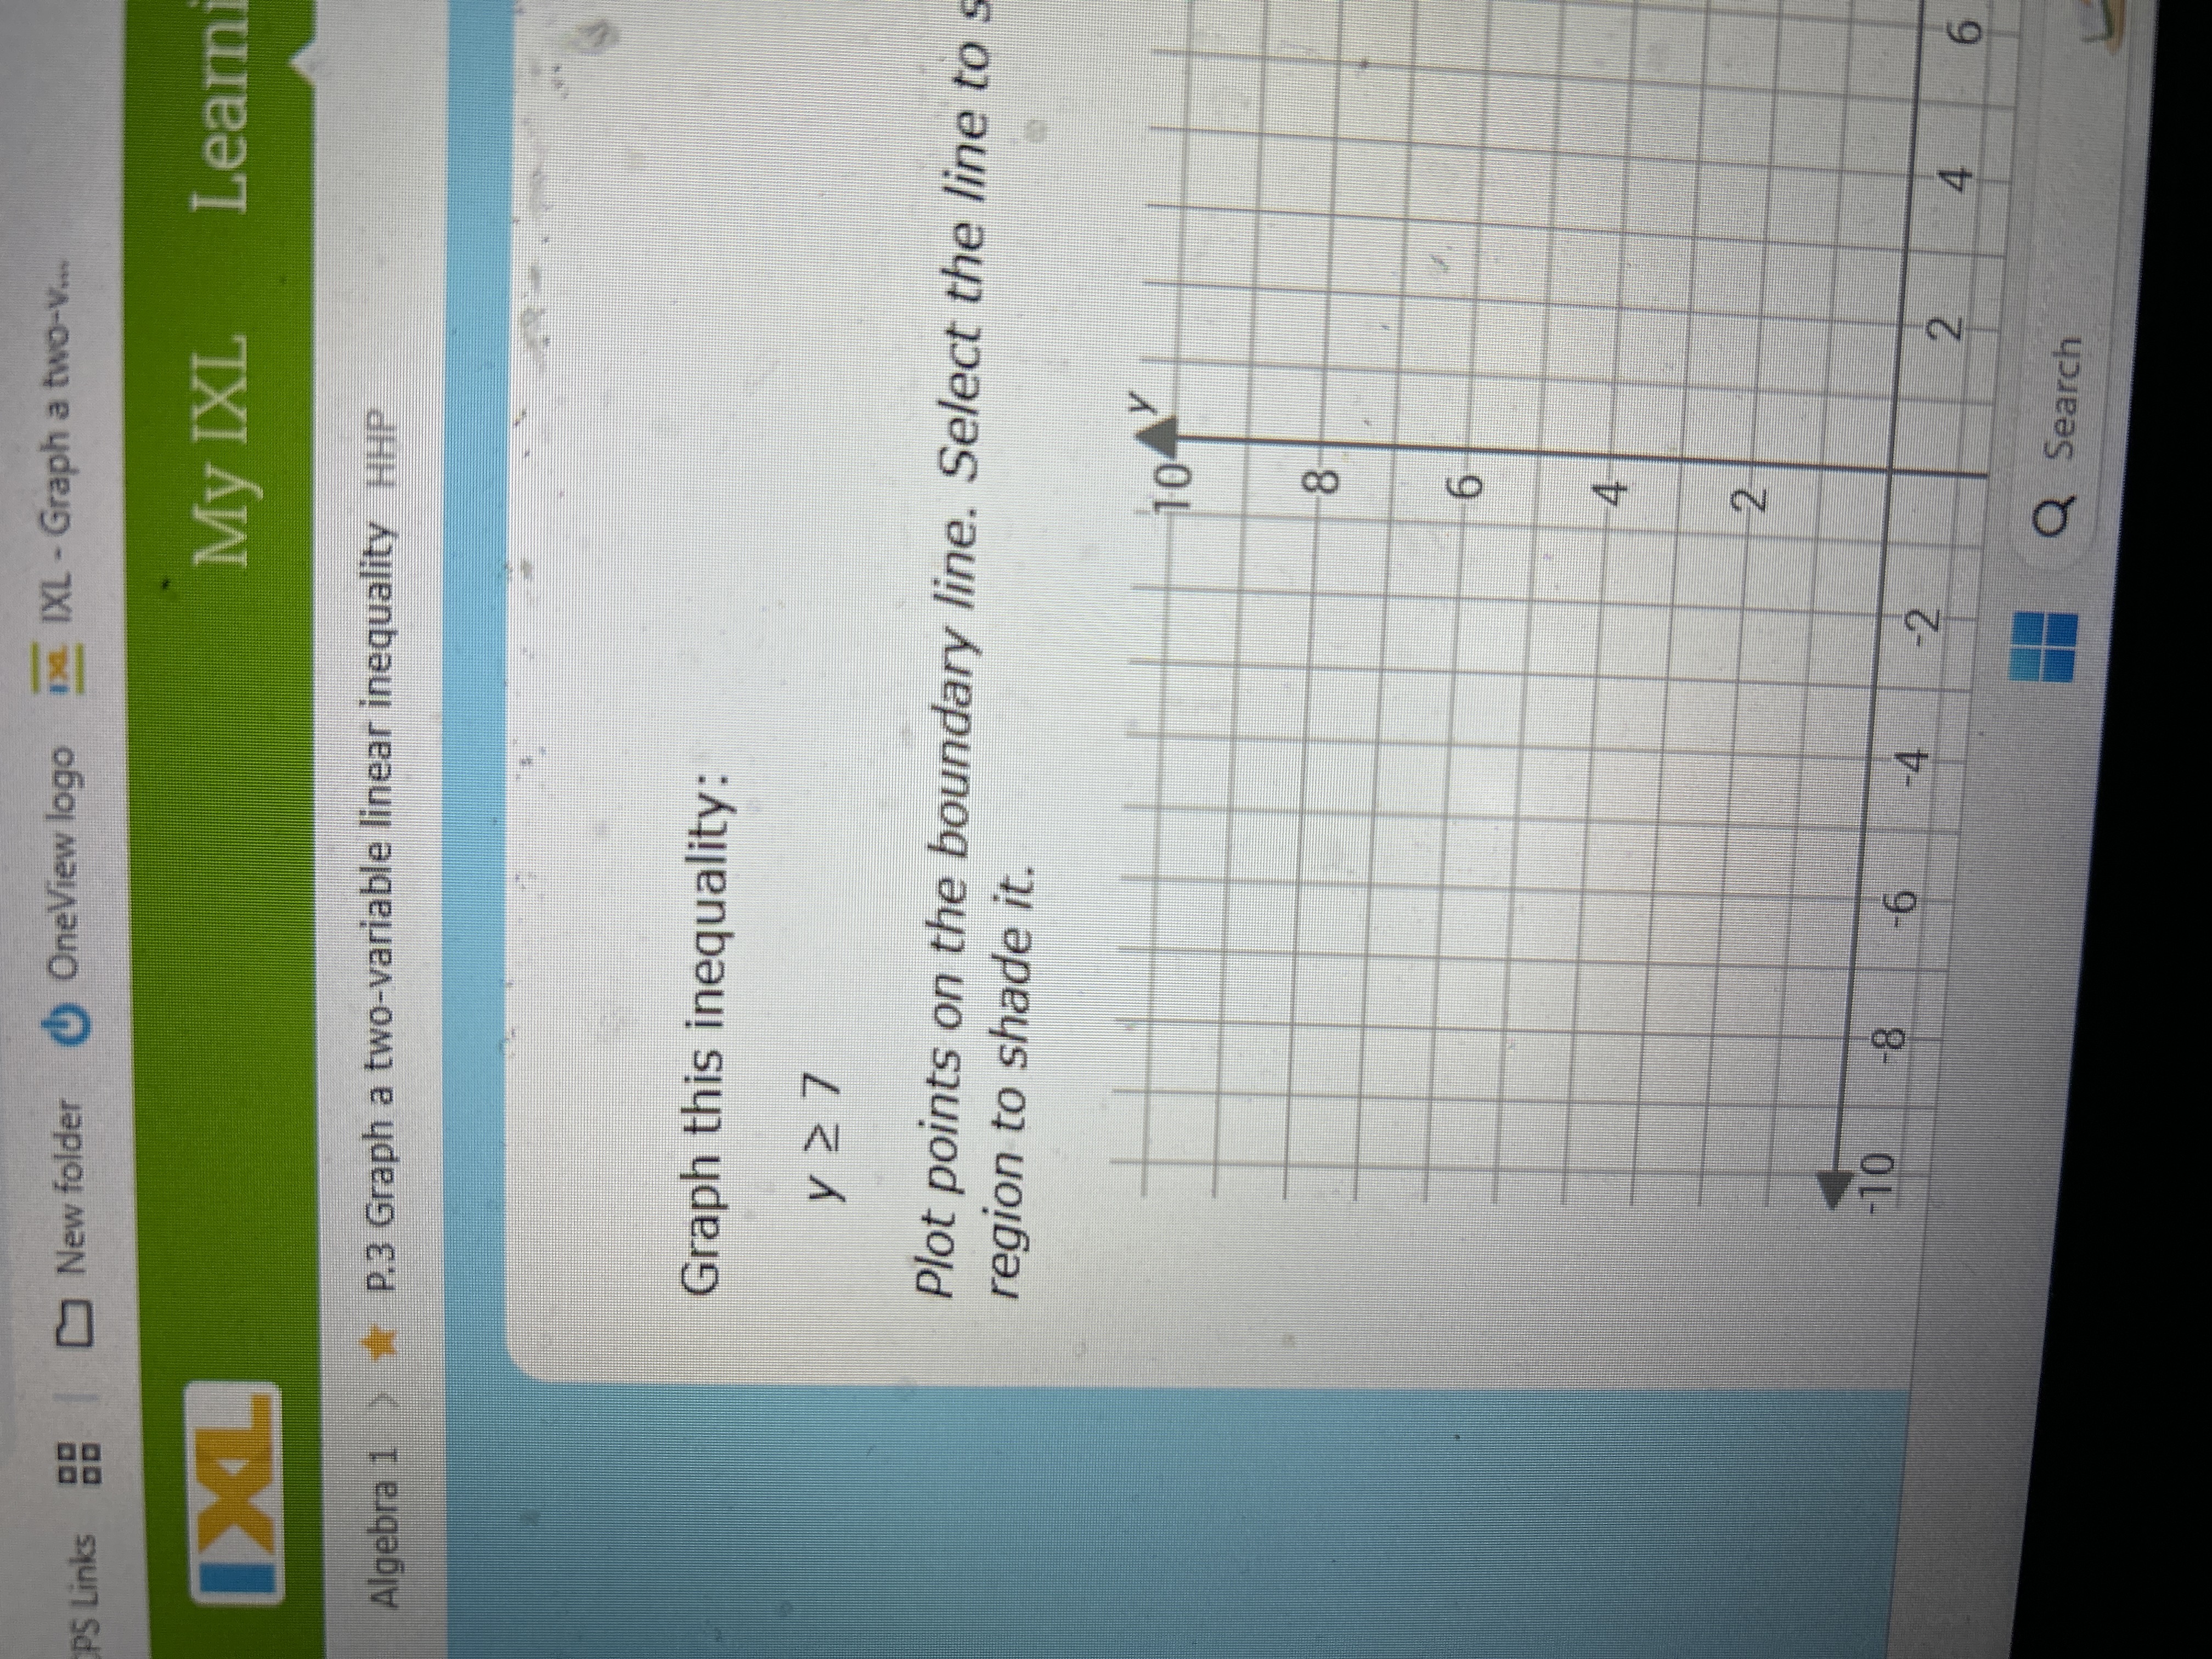
Graph this inequality: y ≥ 7. Plot points on the boundary line. Select the line to shade the region.

Understand the Problem
The question is asking to graph the inequality y ≥ 7, indicating that we need to plot this inequality on a coordinate system, specifically representing the boundary line and shading the appropriate area to signify the solution set.
Answer
Graph a solid horizontal line at $y = 7$ and shade the region above it to represent $y \geq 7$.
Answer for screen readers
The graph shows a solid horizontal line at $y = 7$, with the region above the line shaded to indicate that $y$ can be any value greater than or equal to 7.
Steps to Solve
- Identify the boundary line
The inequality $y \geq 7$ indicates that the boundary line is the line $y = 7$. This line is horizontal because it does not depend on $x$.
- Graph the boundary line
Draw a horizontal line on the coordinate plane at $y = 7$. Since the inequality is $y \geq 7$, we will use a solid line to indicate that the points on the line are included in the solution set.
- Determine the shaded region
Since the inequality is $y \geq 7$, we need to shade the area above the line. This represents all points where $y$ values are greater than or equal to 7.
- Label the graph
Make sure to label your axes and the line $y = 7$ for clarity.
The graph shows a solid horizontal line at $y = 7$, with the region above the line shaded to indicate that $y$ can be any value greater than or equal to 7.
More Information
This inequality represents a range of values where the output $y$ is at least 7. Such inequalities often model situations where a minimum threshold is required.
Tips
- Forgetting to use a solid line when the inequality includes equality (≥).
- Shading the incorrect region; make sure to shade above the line for $y \geq 7$.
AI-generated content may contain errors. Please verify critical information