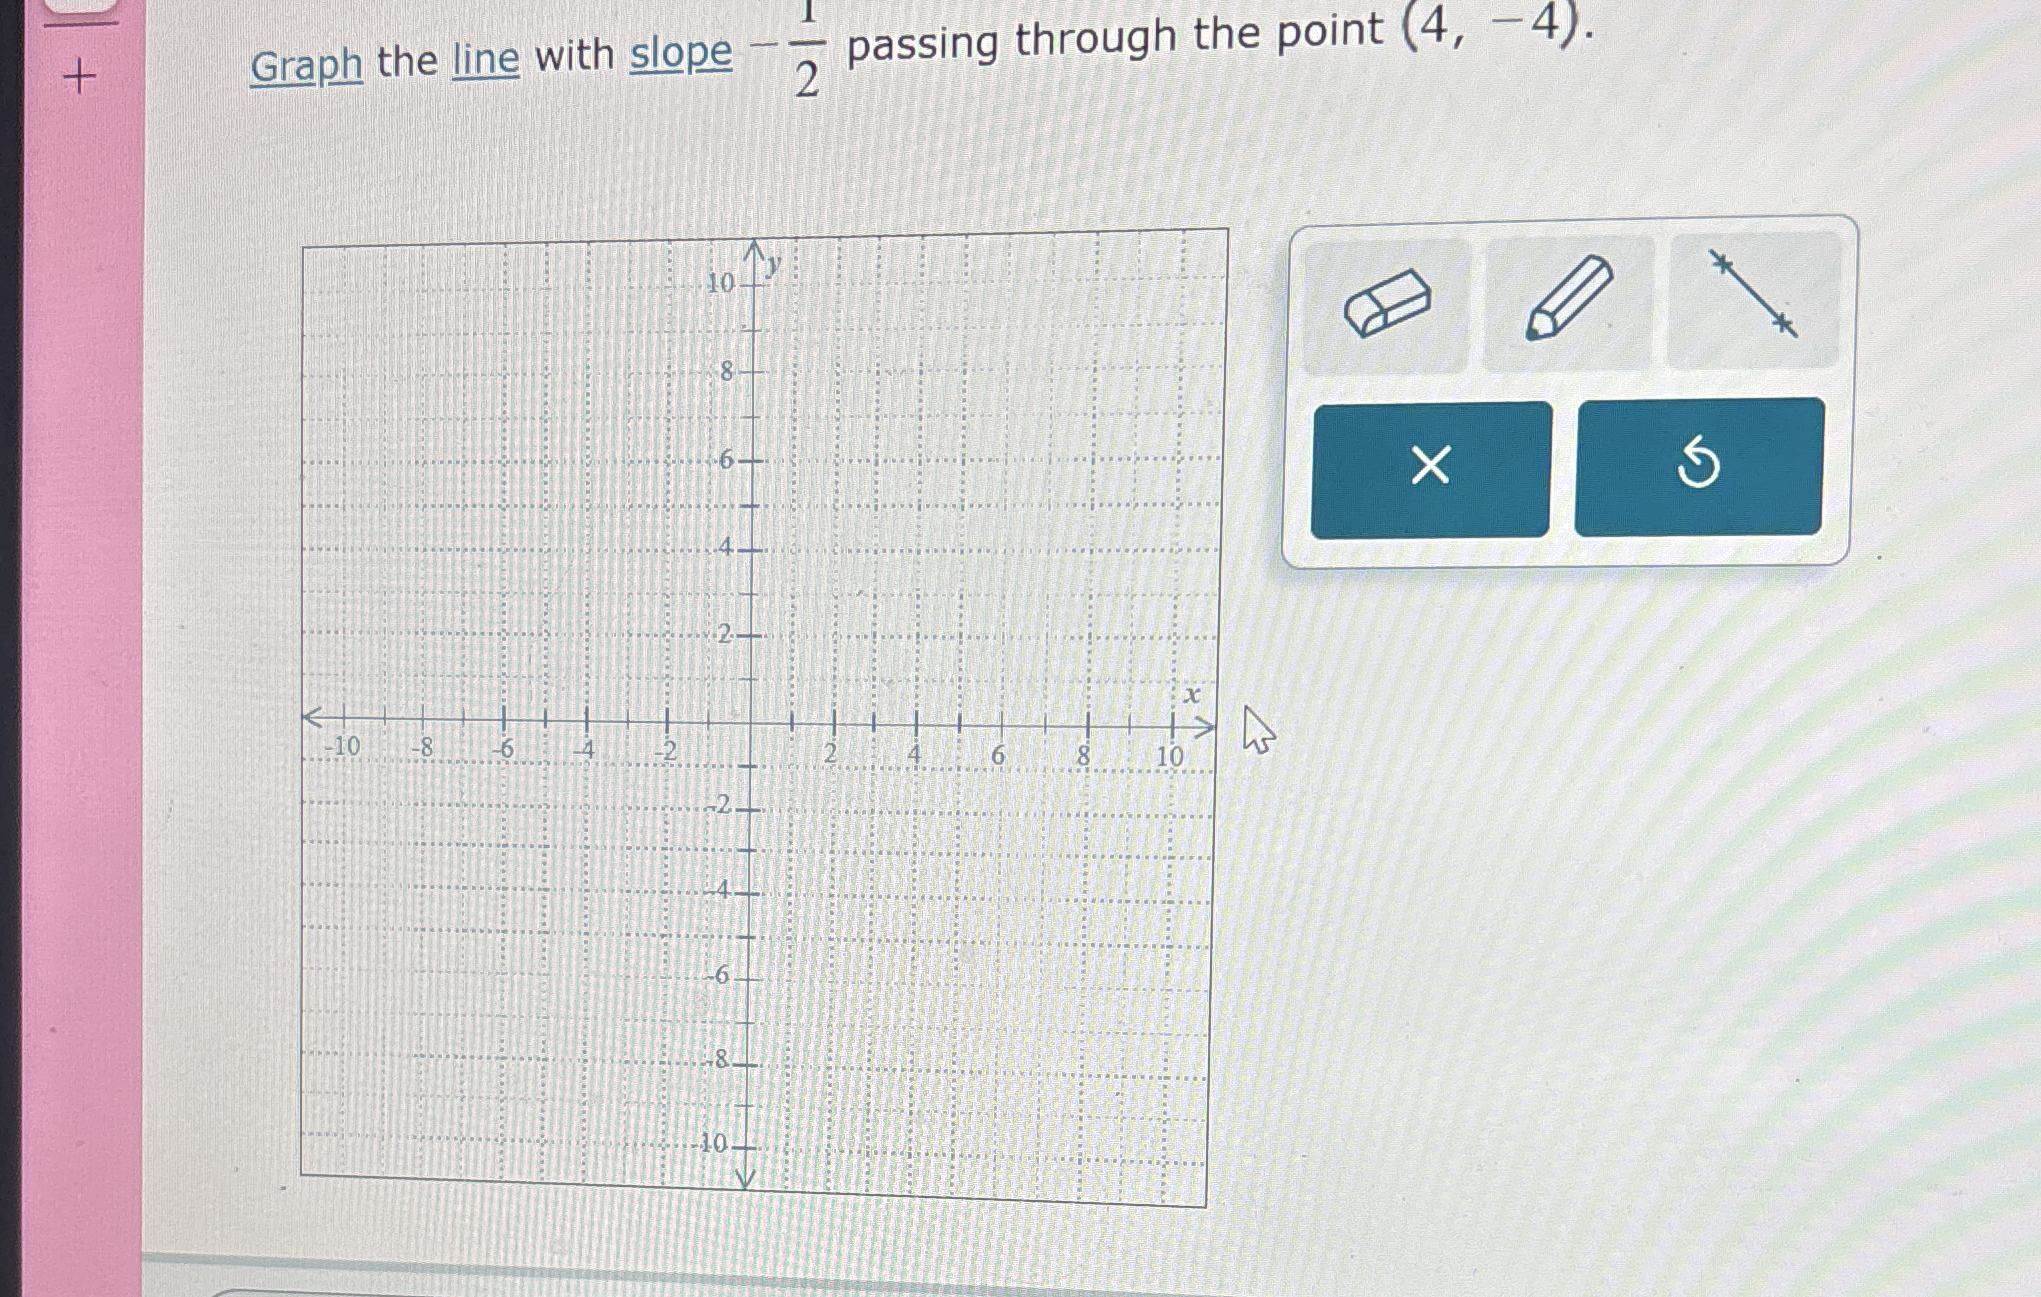
Graph the line with slope -1/2 passing through the point (4, -4).
Understand the Problem
The question asks to graph a line given its slope and a point it passes through. The slope is -1/2 and the point is (4, -4). To graph this line, plot the point (4, -4) and use the slope to find another point on the line. Since the slope is -1/2, go down 1 unit and right 2 units from (4, -4) to find a point on the line until it is plottable on the graph provided.
Answer
The line with slope $\frac{-1}{2}$ passing through (4, -4) is $y = -\frac{1}{2}x - 2$.
Answer for screen readers
The graph of the line with slope $\frac{-1}{2}$ passing through the point (4, -4) is shown below.
\begin{tikzpicture}[scale=0.5]
\begin{axis}[
    axis lines = center,
    xmin=-10, xmax=10,
    ymin=-10, ymax=10,
    xlabel=$x$, ylabel=$y$,
    xtick={-10,-8,-6,-4,-2,2,4,6,8,10},
    ytick={-10,-8,-6,-4,-2,2,4,6,8,10},
    ]
    \addplot[domain=-10:10, samples=100, thick] {-0.5*x - 2};
    \addplot[mark=*, mark size=3pt] coordinates {(4,-4)};
\end{axis}
\end{tikzpicture}
Steps to Solve
- Plot the given point
Plot the point (4, -4) on the coordinate plane.
- Use the slope to find another point
The slope is $\frac{-1}{2}$. This means for every 1 unit we move down (negative direction on the y-axis), we move 2 units to the right (positive direction on the x-axis). Starting from (4, -4), move down 1 unit to y = -5, and move 2 units to the right to x = 6. This gives us the point (6, -5).
- Plot the second point
Plot the point (6, -5) on the coordinate plane.
- Draw the line
Draw a straight line that passes through the two points (4, -4) and (6, -5).
The graph of the line with slope $\frac{-1}{2}$ passing through the point (4, -4) is shown below.
\begin{tikzpicture}[scale=0.5]
\begin{axis}[
    axis lines = center,
    xmin=-10, xmax=10,
    ymin=-10, ymax=10,
    xlabel=$x$, ylabel=$y$,
    xtick={-10,-8,-6,-4,-2,2,4,6,8,10},
    ytick={-10,-8,-6,-4,-2,2,4,6,8,10},
    ]
    \addplot[domain=-10:10, samples=100, thick] {-0.5*x - 2};
    \addplot[mark=*, mark size=3pt] coordinates {(4,-4)};
\end{axis}
\end{tikzpicture}
More Information
The slope-intercept form of the line is $y = -\frac{1}{2}x - 2$.
Tips
A common mistake is to misinterpret the slope. For example, plotting the slope as $\frac{2}{-1}$ instead of $\frac{-1}{2}$ results in the wrong line. Also, make sure to plot the point accurately.
AI-generated content may contain errors. Please verify critical information