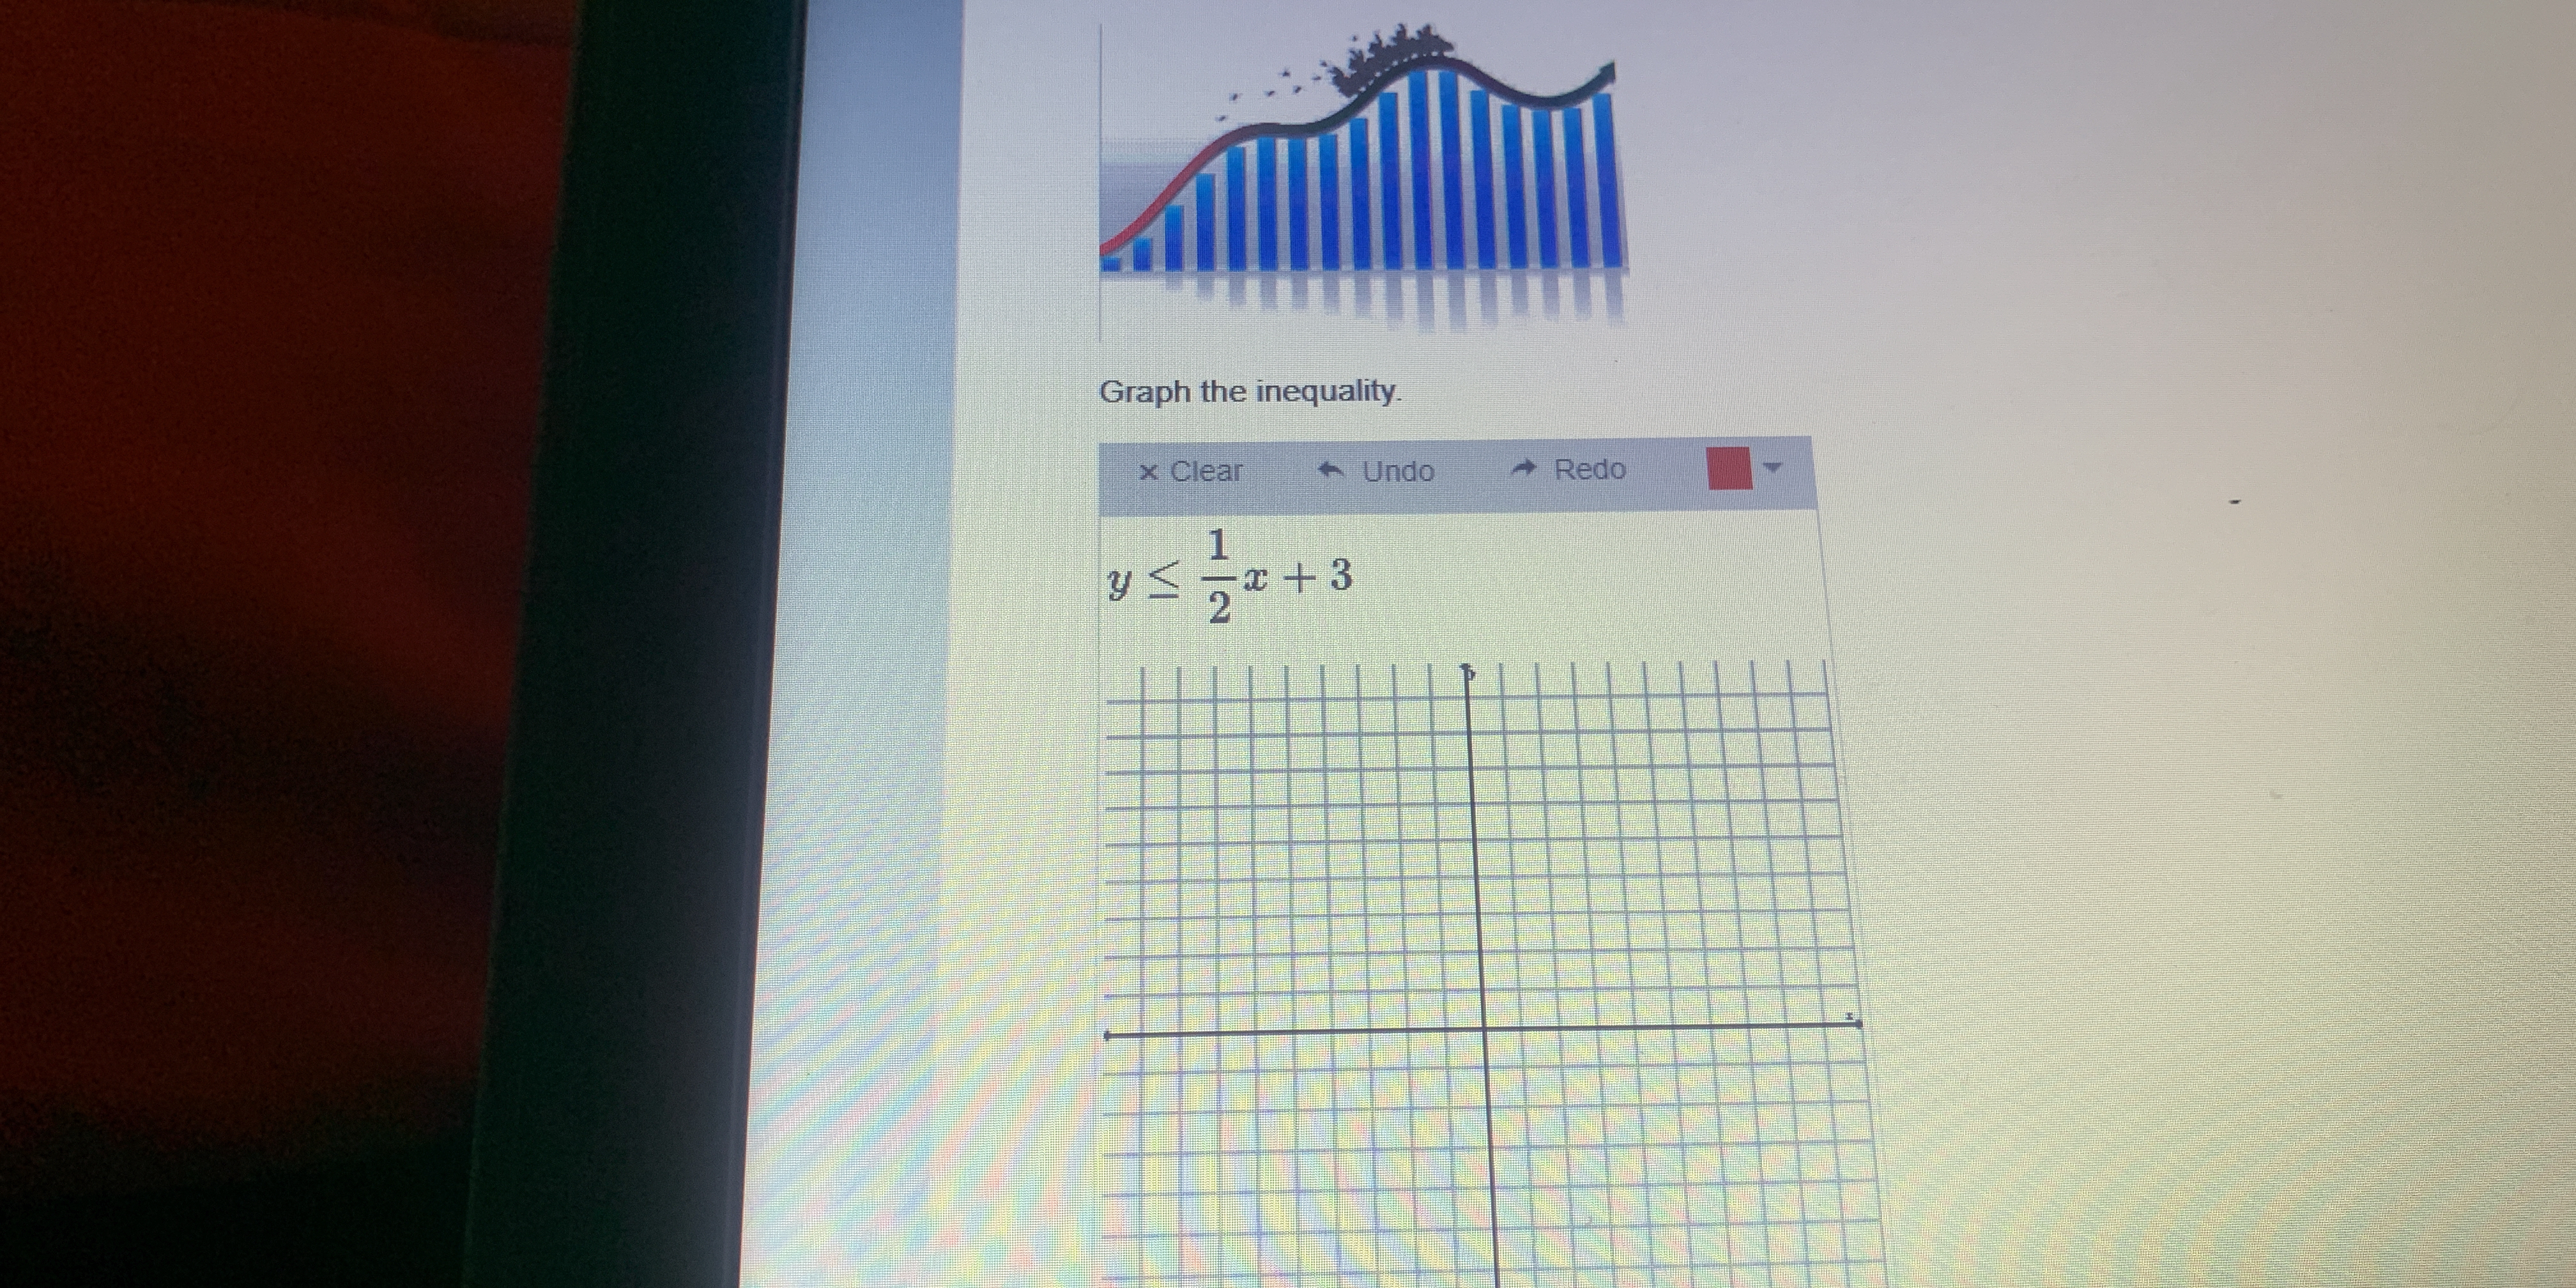
Graph the inequality y ≤ (1/2)x + 3.

Understand the Problem
The question is asking to graph the inequality y ≤ (1/2)x + 3. This involves plotting the line represented by the equation y = (1/2)x + 3 and shading the area where y is less than or equal to this line.
Answer
The graph includes a solid line for $y = \frac{1}{2}x + 3$ and shades the region below it.
Answer for screen readers
The graph of the inequality $y \leq \frac{1}{2}x + 3$ includes a solid line for $y = \frac{1}{2}x + 3$ and shades the region below this line.
Steps to Solve
- Identify the Boundary Line
Start by rewriting the inequality in slope-intercept form: $$ y = \frac{1}{2}x + 3 $$
- Graph the Boundary Line
Plot the line $y = \frac{1}{2}x + 3$ on the graph.
- The y-intercept is at (0, 3).
- The slope is $\frac{1}{2}$, which means for every 2 units you move right (positive x-direction), you move up 1 unit (positive y-direction).
- Determine the Line Style
Since the inequality is $\leq$, graph a solid line to indicate that points on the line are included in the solution.
- Shade the Appropriate Region
Since the inequality states $y \leq \frac{1}{2}x + 3$, shade the area below the line. This represents all points where y is less than or equal to the boundary line.
The graph of the inequality $y \leq \frac{1}{2}x + 3$ includes a solid line for $y = \frac{1}{2}x + 3$ and shades the region below this line.
More Information
The inequality $y \leq \frac{1}{2}x + 3$ represents all the points (x, y) that lie on or below the line defined by the equation. It shows that for every x value, y can be equal to or less than the value calculated from the equation.
Tips
- Using a dashed line: Remember to use a solid line for $\leq$ or $\geq$ inequalities, as these include the points on the line.
- Shading the wrong side: Ensure you shade below the line for $y \leq$, as this captures all valid solutions.
AI-generated content may contain errors. Please verify critical information