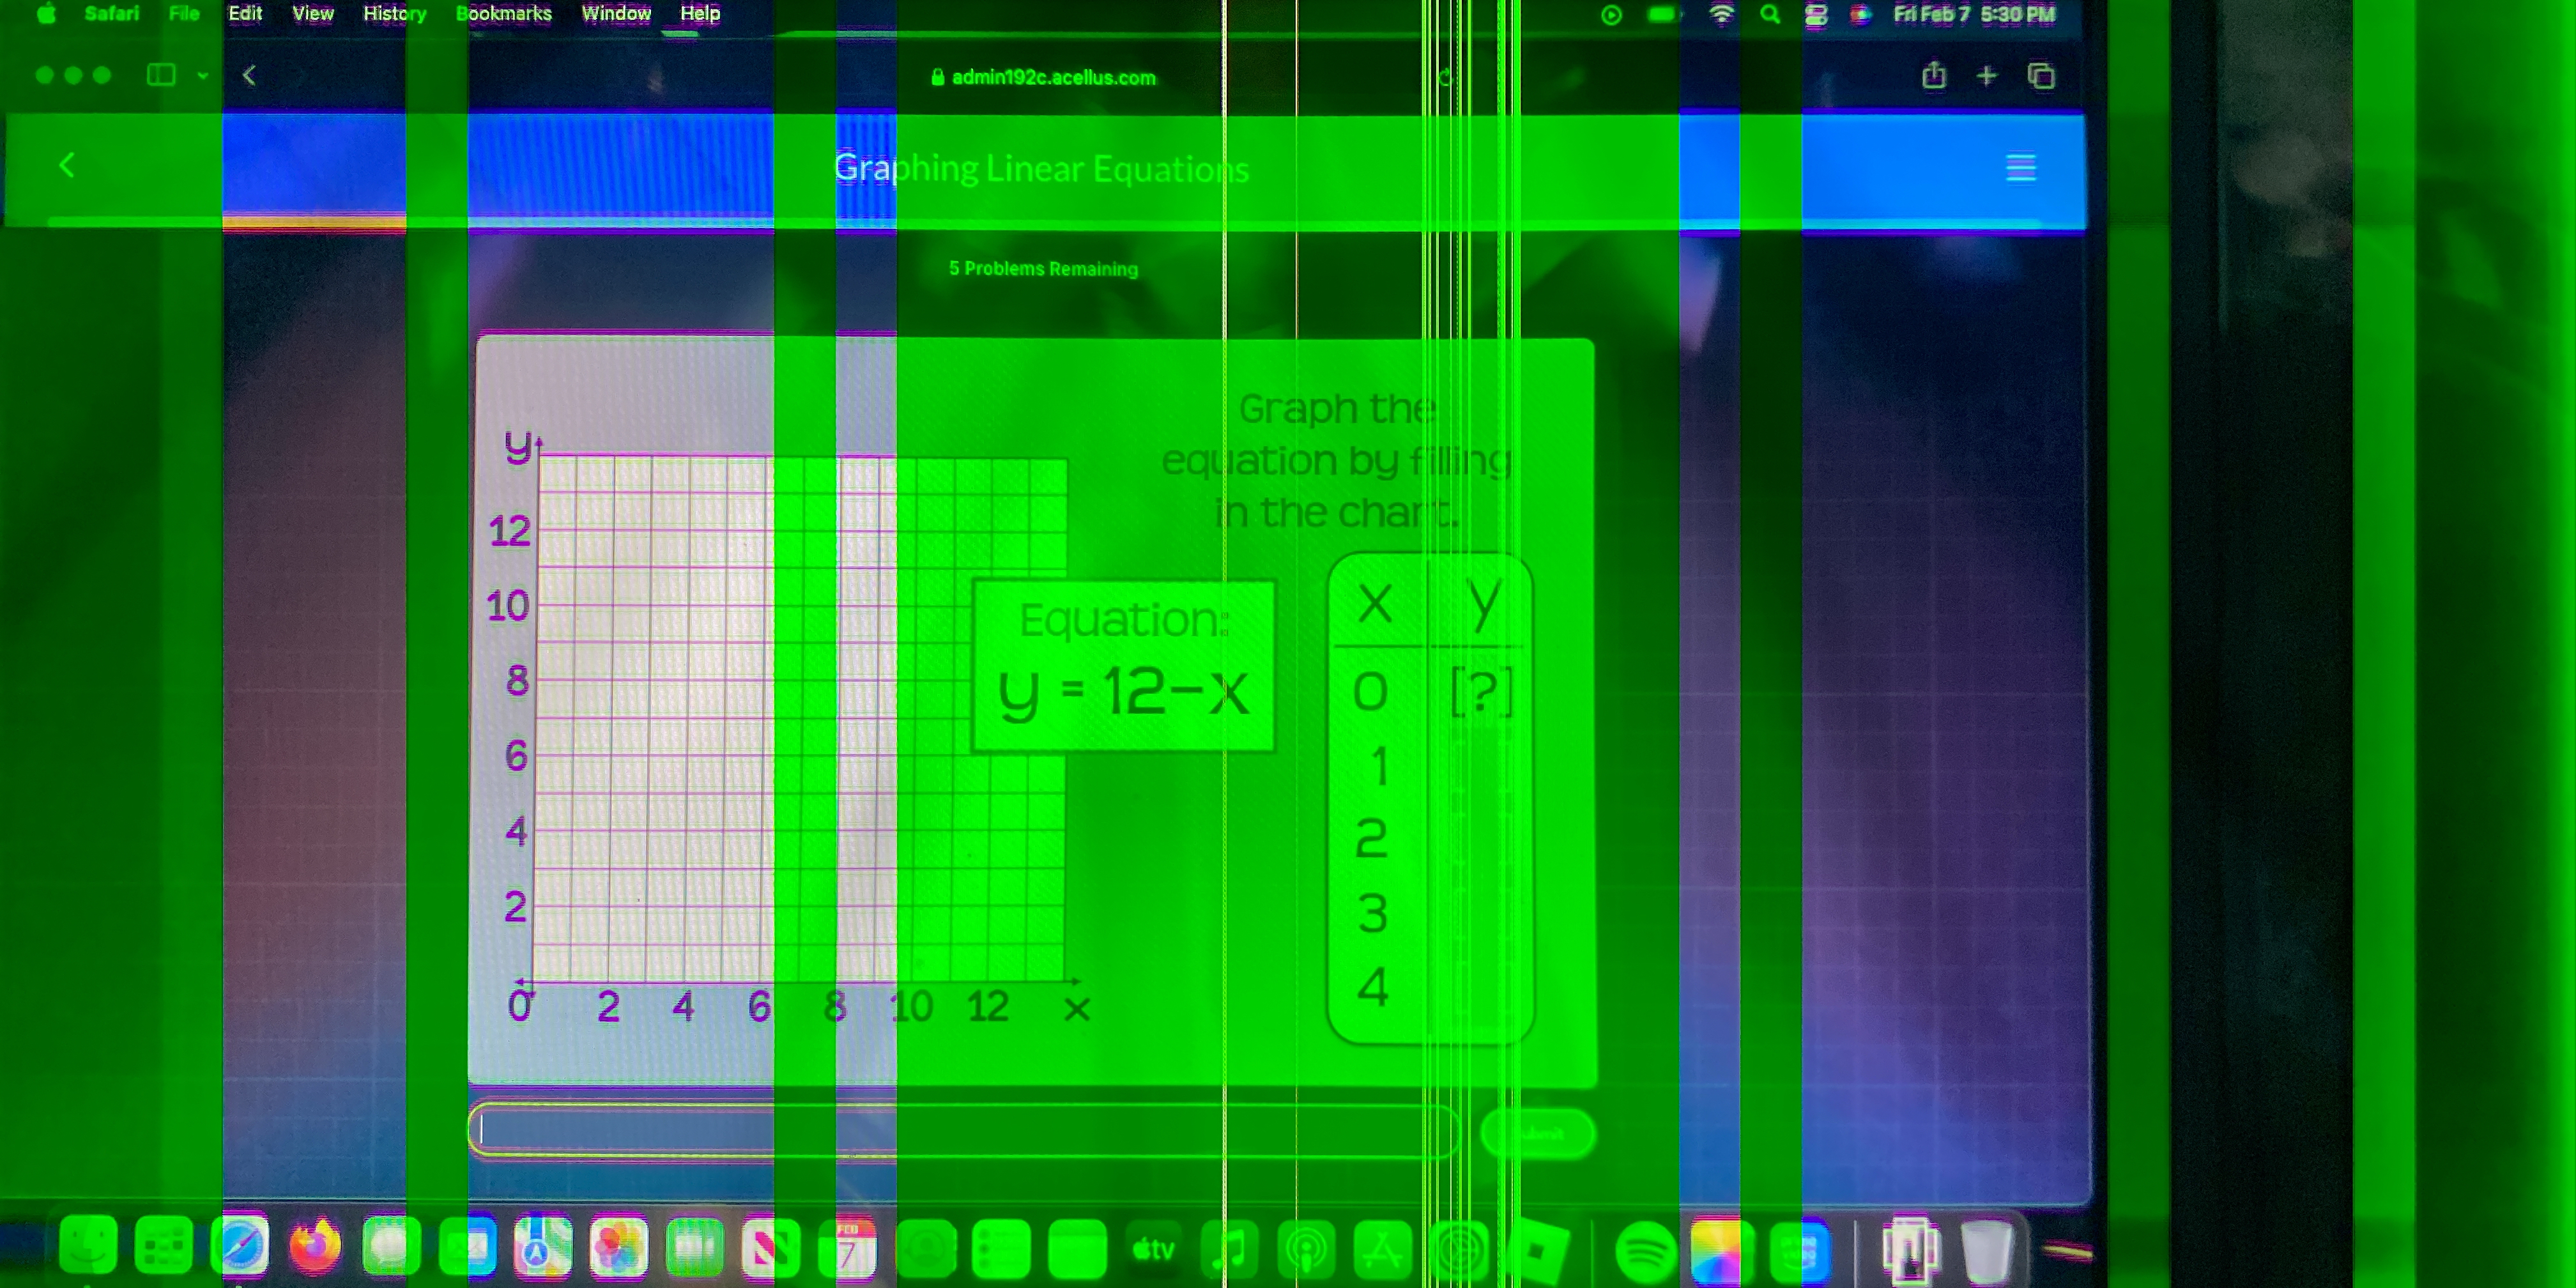
Graph the equation y = 12 - x by filling in the chart.

Understand the Problem
The question is asking how to graph the linear equation y = 12 - x by filling in the corresponding chart for values of x and y.
Answer
The filled chart shows $(x, y)$ pairs calculated from $y = 12 - x$. Each corresponding $y$ value is determined by substituting each $x$ into the equation.
Answer for screen readers
The filled chart is:
| x | y |
|---|---|
| 0 | 12 |
| 1 | 11 |
| 2 | 10 |
| 3 | 9 |
| 4 | 8 |
| 5 | 7 |
| 6 | 6 |
| 7 | 5 |
| 8 | 4 |
| 9 | 3 |
| 10 | 2 |
| 11 | 1 |
| 12 | 0 |
Steps to Solve
-
Identify values for x
Create a table with several values of $x$. Common choices are integers, such as $0, 1, 2, 3, 4, 5, 6, 7, 8, 9, 10, 11, 12$. -
Calculate corresponding y values
Using the equation $y = 12 - x$, substitute each $x$ value into the equation to find the corresponding $y$ values. For example:
- If $x = 0$, then $y = 12 - 0 = 12$
- If $x = 1$, then $y = 12 - 1 = 11$
Continue this for all chosen $x$ values.
-
Create a filled chart
Fill in the chart with the calculated $y$ values corresponding to each $x$. -
Graphing the points
Once the chart is filled, use the pairs $(x, y)$ to plot points on the graph. Connect these points to see the linear equation.
The filled chart is:
| x | y |
|---|---|
| 0 | 12 |
| 1 | 11 |
| 2 | 10 |
| 3 | 9 |
| 4 | 8 |
| 5 | 7 |
| 6 | 6 |
| 7 | 5 |
| 8 | 4 |
| 9 | 3 |
| 10 | 2 |
| 11 | 1 |
| 12 | 0 |
More Information
This equation represents a straight line with a negative slope, starting at $y = 12$ when $x = 0$ and dropping to $y = 0$ when $x = 12$. Graphing it helps visualize linear relationships.
Tips
- Forgetting to substitute the correct $x$ value into the equation, which leads to incorrect $y$ values.
- Not using a range of $x$ values leading to an incomplete understanding of the graph.
AI-generated content may contain errors. Please verify critical information