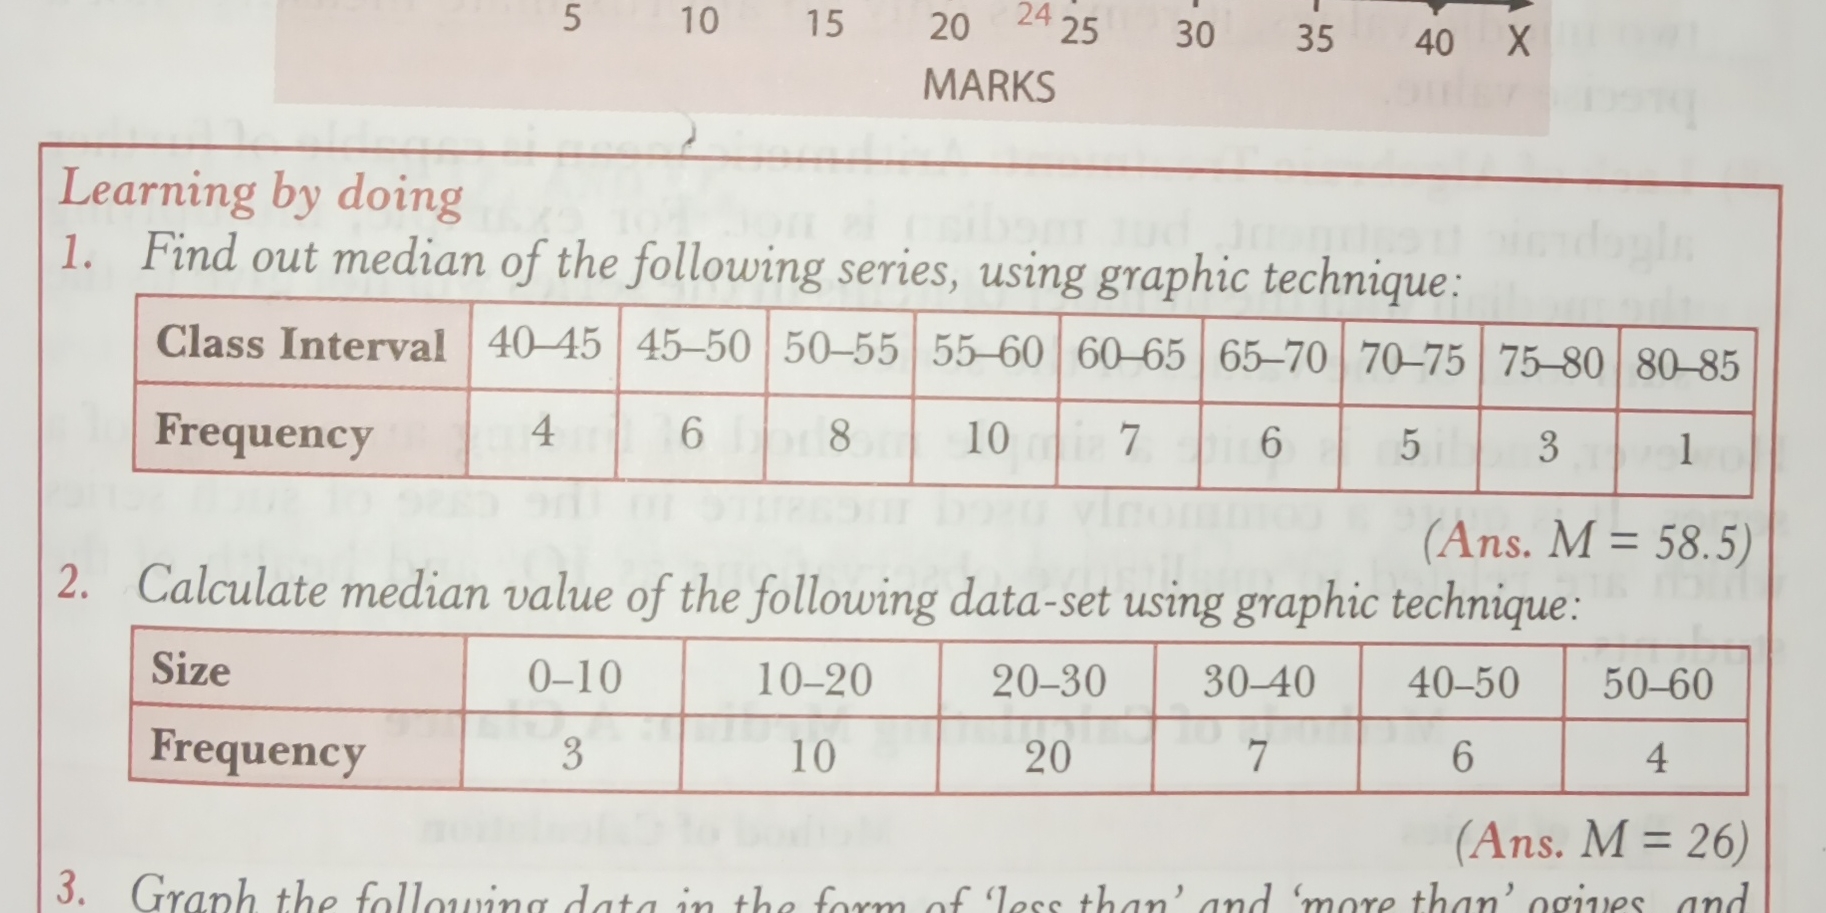
Find the median of the following series using a graphic technique: Class Interval: 40-45, 45-50, 50-55, 55-60, 60-65, 65-70, 70-75, 75-80, 80-85 Frequency: 4, 6, 8, 10, 7, 6, 5, 3... Find the median of the following series using a graphic technique: Class Interval: 40-45, 45-50, 50-55, 55-60, 60-65, 65-70, 70-75, 75-80, 80-85 Frequency: 4, 6, 8, 10, 7, 6, 5, 3, 1 Calculate the median value of the following data set using a graphic technique: Size: 0-10, 10-20, 20-30, 30-40, 40-50, 50-60 Frequency: 3, 10, 20, 7, 6, 4 Graph the following data in the form of 'less than' and 'more than' ogives.
Understand the Problem
The image contains a set of questions related to statistics, focusing on finding the median of data sets using graphic techniques. The questions involve analyzing class intervals and their corresponding frequencies to determine the median value.
Answer
1. Median of the first series $\approx 58.5$ 2. Median of the second series $\approx 26$ 3. Plot the "less than" and "more than" ogives as described in the steps.
Answer for screen readers
- The median of the first series is approximately $58.5$.
- The median of the second series is approximately $26$.
- The two ogives should be plotted as described in the steps, however this cannot be done in markdown.
Steps to Solve
- Calculate Cumulative Frequencies (Less than type) for the first series
To find the median using the graphic technique (ogives), we need to calculate the cumulative frequencies. This involves adding the frequencies as we move through the class intervals.
Less than 45: 4 Less than 50: $4 + 6 = 10$ Less than 55: $10 + 8 = 18$ Less than 60: $18 + 10 = 28$ Less than 65: $28 + 7 = 35$ Less than 70: $35 + 6 = 41$ Less than 75: $41 + 5 = 46$ Less than 80: $46 + 3 = 49$ Less than 85: $49 + 1 = 50$
- Calculate Cumulative Frequencies (More than type) for the first series
More than 40: 50 More than 45: $50 - 4 = 46$ More than 50: $46 - 6 = 40$ More than 55: $40 - 8 = 32$ More than 60: $32 - 10 = 22$ More than 65: $22 - 7 = 15$ More than 70: $15 - 6 = 9$ More than 75: $9 - 5 = 4$ More than 80: $4 - 3 = 1$
- Draw the Ogives and Find the Intersection Point for the first series
Plot 'less than' and 'more than' ogives on a graph where x-axis represents the Class Intervals and the y-axis represents the Cumulative Frequencies.
'Less than' Ogive: Plot points (45, 4), (50, 10), (55, 18), (60, 28), (65, 35), (70, 41), (75, 46), (80, 49), (85, 50). 'More than' Ogive: Plot points (40, 50), (45, 46), (50, 40), (55, 32), (60, 22), (65, 15), (70, 9), (75, 4), (80, 1). Find the point where the two ogives intersect. The x-coordinate of this intersection point will give the median.
- Calculate Cumulative Frequencies (Less than type) for the second series
Less than 10: 3 Less than 20: $3 + 10 = 13$ Less than 30: $13 + 20 = 33$ Less than 40: $33 + 7 = 40$ Less than 50: $40 + 6 = 46$ Less than 60: $46 + 4 = 50$
- Calculate Cumulative Frequencies (More than type) for the second series
More than 0: 50 More than 10: $50 - 3 = 47$ More than 20: $47 - 10 = 37$ More than 30: $37 - 20 = 17$ More than 40: $17 - 7 = 10$ More than 50: $10 - 6 = 4$
- Draw the Ogives and Find the Intersection Point for the second series
Plot 'less than' and 'more than' ogives on a graph where x-axis represents the Size and the y-axis represents the Cumulative Frequencies.
'Less than' Ogive: Plot points (10, 3), (20, 13), (30, 33), (40, 40), (50, 46), (60, 50). 'More than' Ogive: Plot points (0, 50), (10, 47), (20, 37), (30, 17), (40, 10), (50, 4). Find the point where the two ogives intersect. The x-coordinate of this intersection point will give the median.
- The median of the first series is approximately $58.5$.
- The median of the second series is approximately $26$.
- The two ogives should be plotted as described in the steps, however this cannot be done in markdown.
More Information
The graphical method of finding the median using ogives provides a visual representation of the data's central tendency. The point of intersection represents the median value, where 50% of the data falls below and 50% falls above.
Tips
- Not calculating the cumulative frequencies correctly. Make sure to add the frequencies correctly along with keeping track of whether you're doing 'less than' or 'more than' cumulative frequency.
- Incorrectly plotting the points on the graph. Ensure the x and y coordinates and axes are correct.
- Misreading the intersection point on the graph. Use a ruler or straight edge to accurately determine the x-coordinate of the intersection.
AI-generated content may contain errors. Please verify critical information