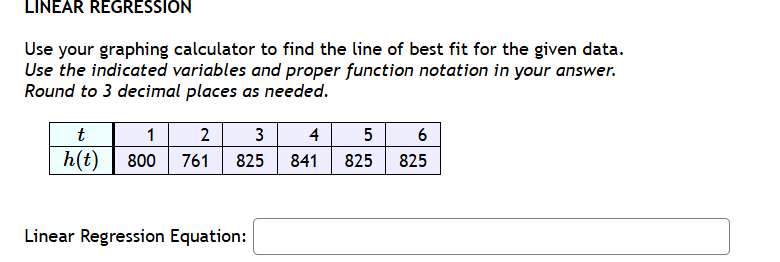
Find the line of best fit for the following data using a graphing calculator. Use the indicated variables and proper function notation in your answer. Round to 3 decimal places as... Find the line of best fit for the following data using a graphing calculator. Use the indicated variables and proper function notation in your answer. Round to 3 decimal places as needed. t 1 2 3 4 5 6 h(t) 800 761 825 841 825 825
Understand the Problem
The question asks to find the line of best fit for the given data using a graphing calculator. Specifically, it asks us to express this line in proper function notation using the variables t and h(t), and round to 3 decimal places.
Answer
$h(t) = 9.714t + 781.571$
Answer for screen readers
$h(t) = 9.714t + 781.571$
Steps to Solve
- Input the data into the graphing calculator
Enter the values of $t$ into list L1 and the values of $h(t)$ into list L2 in your graphing calculator. To do this, press STAT, then select 1:Edit.
- Calculate the linear regression equation
Press STAT, then move to CALC and select 4:LinReg(ax+b). Specify L1 as the Xlist and L2 as the Ylist. Calculate to obtain the values for $a$ (slope) and $b$ (y-intercept).
- Write the equation in slope-intercept form
The graphing calculator will output the values of $a$ and $b$ for the linear regression equation $y = ax + b$. In this case, we are using the variables $t$ and $h(t)$, so we can write the equation as $h(t) = at + b$.
- Substitute the calculated values and round
Substitute the values of $a$ and $b$ obtained from the calculator into the equation $h(t) = at + b$. Round the values of $a$ and $b$ to three decimal places as specified in the question.
Using a TI-84 calculator, I get the values $a = 9.714$ and $b = 781.571$.
Therefore, the equation is $h(t) = 9.714t + 781.571$.
$h(t) = 9.714t + 781.571$
More Information
Linear regression finds the line that best fits a set of data points by minimizing the sum of the squares of the vertical distances from each data point to the line (least squares method). Graphing calculators have built-in functions to perform this calculation. The equation is in slope-intercept form.
Tips
A common mistake is not rounding to the correct number of decimal places. Another mistake is using the wrong variables or function notation.
AI-generated content may contain errors. Please verify critical information