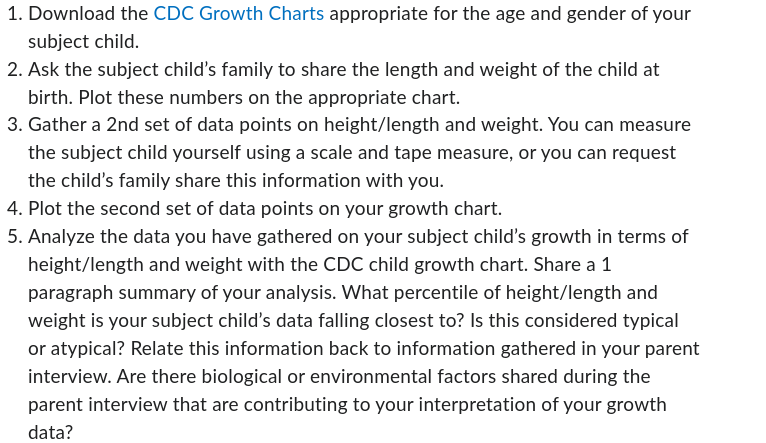
Download the CDC Growth Charts appropriate for the age and gender of your subject child. Ask the subject child's family to share the length and weight of the child at birth. Plot t... Download the CDC Growth Charts appropriate for the age and gender of your subject child. Ask the subject child's family to share the length and weight of the child at birth. Plot these numbers on the appropriate chart. Gather a 2nd set of data points on height/length and weight. You can measure the subject child yourself using a scale and tape measure, or you can request the child's family share this information with you. Plot the second set of data points on your growth chart. Analyze the data you have gathered on your subject child's growth in terms of height/length and weight with the CDC child growth chart. Share a 1 paragraph summary of your analysis. What percentile of height/length and weight is your subject child's data falling closest to? Is this considered typical or atypical? Relate this information back to information gathered in your parent interview. Are there biological or environmental factors shared during the parent interview that are contributing to your interpretation of your growth data?
Understand the Problem
The question outlines a multi-step process for assessing a child's growth using CDC Growth Charts. It involves gathering data on height and weight, plotting this information, and analyzing the results in relation to typical growth patterns and possible influencing factors. The user is asked to synthesize this information in a paragraph summary.
Answer
Use CDC Growth Charts to analyze the child's growth percentile and factors influencing growth.
To complete the task, download CDC Growth Charts for your subject's age and gender from the CDC website. Collect and plot two sets of height/length and weight data. Analyze the child's growth percentiles using the charts to determine typicality. Consider contributing biological or environmental factors from interviews.
Answer for screen readers
To complete the task, download CDC Growth Charts for your subject's age and gender from the CDC website. Collect and plot two sets of height/length and weight data. Analyze the child's growth percentiles using the charts to determine typicality. Consider contributing biological or environmental factors from interviews.
More Information
CDC Growth Charts provide percentile curves for assessing child growth. Typical growth falls around the 50th percentile, but variations can occur due to biological or environmental factors.
Tips
Ensure accurate measurement plotting and consider genetic and lifestyle influences on growth.
Sources
- CDC Growth Charts - cdc.gov
- Growth Charts - CDC - cdc.gov
AI-generated content may contain errors. Please verify critical information