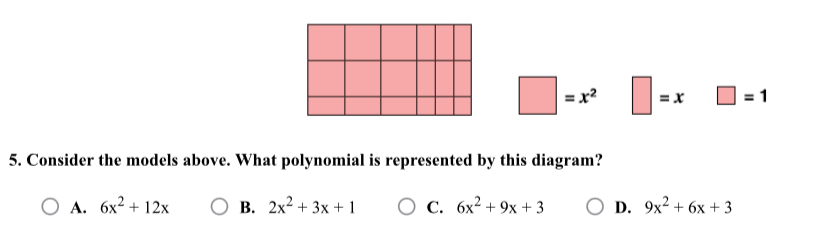
Consider the models above. What polynomial is represented by this diagram?
Understand the Problem
The question asks us to identify the polynomial represented by a diagram. The diagram is a rectangle composed of smaller squares and rectangles of varying sizes, each representing a term in the polynomial. We need to count the number of each type of shape, and then create the corresponding polynomial.
Answer
C. $6x^2 + 9x + 3$
Answer for screen readers
C. $6x^2 + 9x + 3$
Steps to Solve
- Identify the shapes and their values
The diagram contains three types of shapes: squares with area $x^2$, rectangles with area $x$, and small squares with area 1.
- Count the number of each shape
Count the number of each shape in the diagram. We have 6 squares with area $x^2$, 9 rectangles with area $x$, and 3 small squares with area 1.
- Write the polynomial
Combine the counts with the corresponding variables to form the polynomial: $6x^2 + 9x + 3$.
C. $6x^2 + 9x + 3$
More Information
The polynomial $6x^2 + 9x + 3$ represents the total area of the shapes in the diagram.
Tips
A common mistake is miscounting the number of shapes, especially the rectangles representing $x$. Double-checking the count is crucial. Another mistake is confusing the shapes with their values (e.g., thinking the square is $x$ instead of $x^2$).
AI-generated content may contain errors. Please verify critical information