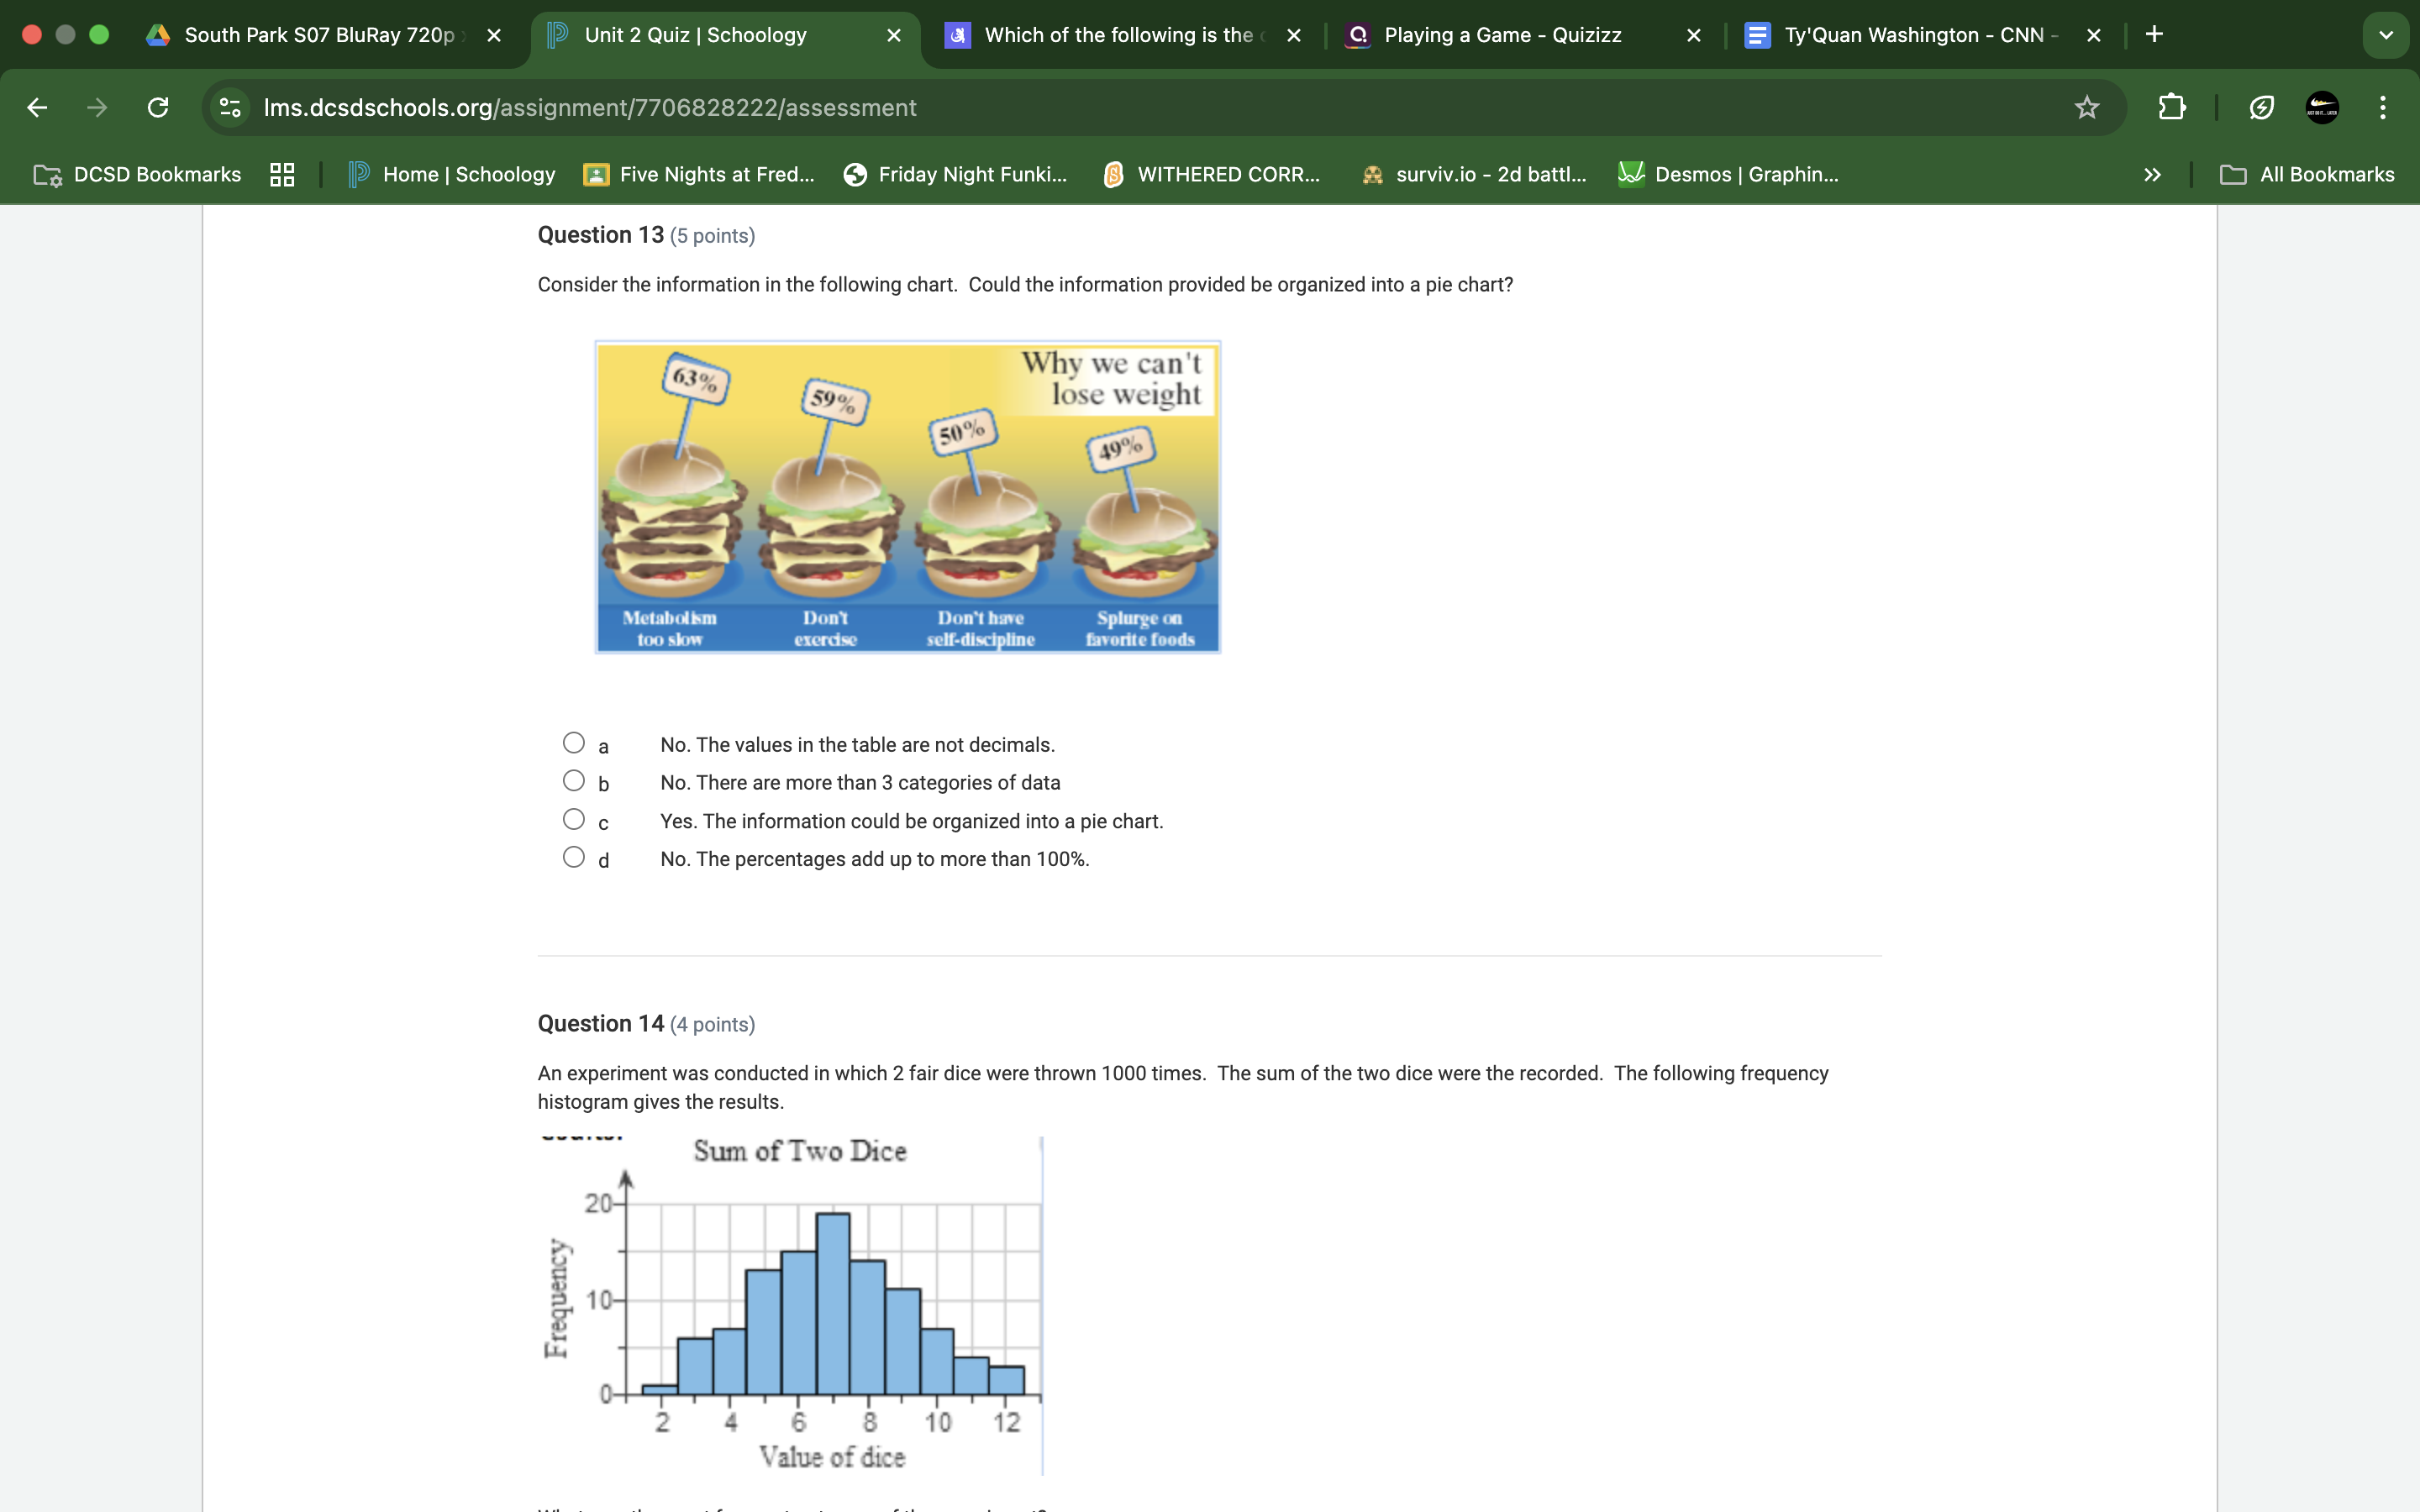
Consider the information in the following chart. Could the information provided be organized into a pie chart?
Understand the Problem
The question is asking whether the provided data can be organized into a pie chart based on the categories and percentages mentioned in the chart.
Answer
The percentages add up to more than 100%.
The information cannot be organized into a pie chart because the percentages add up to more than 100%.
Answer for screen readers
The information cannot be organized into a pie chart because the percentages add up to more than 100%.
More Information
Pie charts represent parts of a whole, so the total must be 100%. If percentages exceed 100%, it indicates overlap or misclassification.
Tips
A common mistake is not verifying that the total of percentages equals 100% when organizing data into a pie chart.
Sources
AI-generated content may contain errors. Please verify critical information
Thank you for voting!