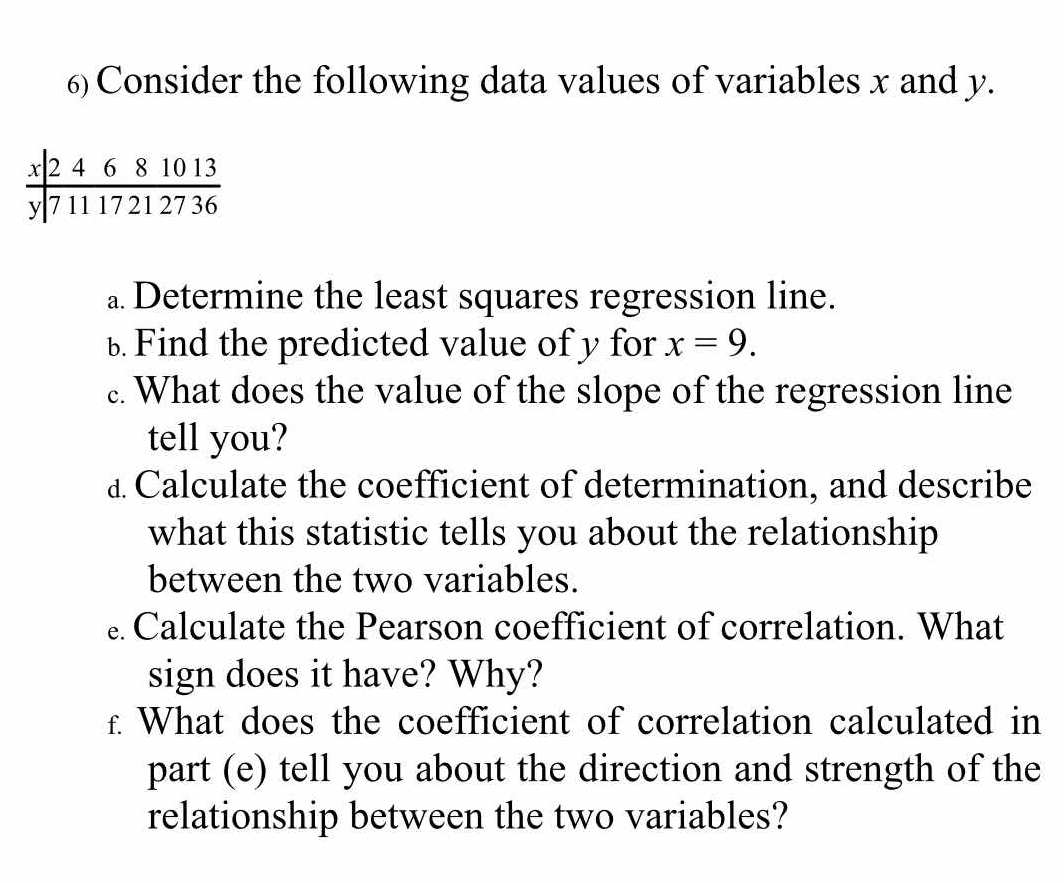
Consider the following data values of variables x and y: x 2 4 6 8 10 13 y 7 11 17 21 27 36 a. Determine the least squares regression line. b. Find the predicted value of y for x... Consider the following data values of variables x and y: x 2 4 6 8 10 13 y 7 11 17 21 27 36 a. Determine the least squares regression line. b. Find the predicted value of y for x = 9. c. What does the value of the slope of the regression line tell you? d. Calculate the coefficient of determination, and describe what this statistic tells you about the relationship between the two variables. e. Calculate the Pearson coefficient of correlation. What sign does it have? Why? f. What does the coefficient of correlation calculated in part (e) tell you about the direction and strength of the relationship between the two variables?
Understand the Problem
The question provides a dataset of x and y values. It asks to determine the least squares regression line, predict a y value for a given x, interpret the slope, calculate/interpret the coefficient of determination, and calculate/interpret the Pearson correlation coefficient.
Answer
a. $\hat{y} = 0.942 + 2.637x$ b. $\hat{y} \approx 24.675$ c. For every unit increase in x, y increases by approximately 2.637 units. d. $R^2 \approx 0.995$. About 99.5% of the variance in y is explained by x. e. $r \approx 0.997$. Positive sign because x and y are positively correlated. f. Strong, positive linear relationship.
Answer for screen readers
a. The least squares regression line is $\hat{y} = 0.942 + 2.637x$. b. The predicted value of y for $x = 9$ is approximately 24.675. c. The slope of the regression line indicates that for every unit increase in x, the value of y increases by approximately 2.637 units. d. The coefficient of determination $R^2$ is approximately 0.995. This means that about 99.5% of the variance in y is explained by the variance in x. e. The Pearson correlation coefficient $r$ is approximately 0.997. It has a positive sign because as x increases, y also tends to increase. f. The coefficient of correlation of 0.997 indicates a strong, positive linear relationship between x and y.
Steps to Solve
-
Calculate the means of x and y First, we calculate the mean of the x values ($\bar{x}$) and the mean of the y values ($\bar{y}$).
$\bar{x} = \frac{2+4+6+8+10+13}{6} = \frac{43}{6} \approx 7.167$
$\bar{y} = \frac{7+11+17+21+27+36}{6} = \frac{119}{6} \approx 19.833$
-
Calculate the slope (b) of the regression line The formula for the slope $b$ is:
$ b = \frac{\sum_{i=1}^{n}(x_i - \bar{x})(y_i - \bar{y})}{\sum_{i=1}^{n}(x_i - \bar{x})^2}$
We need to calculate $\sum_{i=1}^{n}(x_i - \bar{x})(y_i - \bar{y})$ and $\sum_{i=1}^{n}(x_i - \bar{x})^2$.
$x_i$ $y_i$ $x_i - \bar{x}$ $y_i - \bar{y}$ $(x_i - \bar{x})(y_i - \bar{y})$ $(x_i - \bar{x})^2$ 2 7 -5.167 -12.833 66.306 26.698 4 11 -3.167 -8.833 27.972 10.030 6 17 -1.167 -2.833 3.306 1.362 8 21 0.833 1.167 0.972 0.694 10 27 2.833 7.167 20.306 8.026 13 36 5.833 16.167 94.291 34.024 $\sum = 213.153$ $\sum = 80.834$ Therefore, $b = \frac{213.153}{80.834} \approx 2.637$
-
Calculate the y-intercept (a) of the regression line The formula for the y-intercept $a$ is:
$a = \bar{y} - b\bar{x}$
$a = 19.833 - 2.637 * 7.167 \approx 19.833 - 18.891 \approx 0.942$
-
Write the least squares regression line The equation of the least squares regression line is given by:
$\hat{y} = a + bx$
$\hat{y} = 0.942 + 2.637x$
-
Find the predicted value of y for x = 9 Substitute $x = 9$ into the regression equation: $\hat{y} = 0.942 + 2.637 * 9 = 0.942 + 23.733 \approx 24.675$
-
Interpret the slope of the regression line The slope represents the average change in y for each unit change in x. In this case, for every increase of 1 in x, y increases by approximately 2.637.
-
Calculate the coefficient of determination ($R^2$) The formula for $R^2$ is:
$R^2 = \frac{\sum_{i=1}^{n}(\hat{y}i - \bar{y})^2}{\sum{i=1}^{n}(y_i - \bar{y})^2}$ where $\hat{y}_i = a + bx_i$
First, calculate $\hat{y}_i$ for each $x_i$:
$x_i$ $y_i$ $\hat{y}_i = 0.942 + 2.637x_i$ $y_i - \bar{y}$ $\hat{y}_i - \bar{y}$ $(y_i - \bar{y})^2$ $(\hat{y}_i - \bar{y})^2$ 2 7 6.216 -12.833 -13.617 164.686 185.413 4 11 11.490 -8.833 -8.343 78.022 69.606 6 17 16.764 -2.833 -3.069 8.026 9.419 8 21 22.038 1.167 2.205 1.362 4.862 10 27 27.312 7.167 7.479 51.362 55.935 13 36 35.223 16.167 15.390 261.378 236.852 $\sum = 564.736$ $\sum = 561.977$ $R^2 = \frac{561.977}{564.736} \approx 0.995$
$R^2$ describes the proportion of variance in dependent variable explained by independent variable. In this case, about 99.5% of the variance in $y$ is explained by $x$.
-
Calculate the Pearson correlation coefficient (r) The Pearson correlation coefficient $r$ is the square root of the coefficient of determination $R^2$, with the sign being the same as the slope $b$.
$r = \sqrt{R^2} = \sqrt{0.995} \approx 0.997$
Since the slope $b$ is positive, $r$ is also positive.
The sign is positive because as $x$ increases, $y$ also tends to increase.
-
Interpret the Pearson correlation coefficient The correlation coefficient of 0.997 indicates a strong, positive, linear relationship between x and y. As x increases, y strongly tends to increase.
a. The least squares regression line is $\hat{y} = 0.942 + 2.637x$. b. The predicted value of y for $x = 9$ is approximately 24.675. c. The slope of the regression line indicates that for every unit increase in x, the value of y increases by approximately 2.637 units. d. The coefficient of determination $R^2$ is approximately 0.995. This means that about 99.5% of the variance in y is explained by the variance in x. e. The Pearson correlation coefficient $r$ is approximately 0.997. It has a positive sign because as x increases, y also tends to increase. f. The coefficient of correlation of 0.997 indicates a strong, positive linear relationship between x and y.
More Information
The coefficient of determination ($R^2$) always lies between 0 and 1. The closer it is to 1, the better the regression line fits the data. The Pearson correlation coefficient (r) always lies between -1 and 1. The closer it is to 1 or -1, the stronger the linear relationship between the two variables.
Tips
A common mistake would be errors in calculating the means, the slope, or the y-intercept. Also, forgetting to take the square root of $R^2$ to find the value of $r$. Another mistake could be incorrectly interpreting the meaning of the slope, $R^2$, or $r$.
AI-generated content may contain errors. Please verify critical information