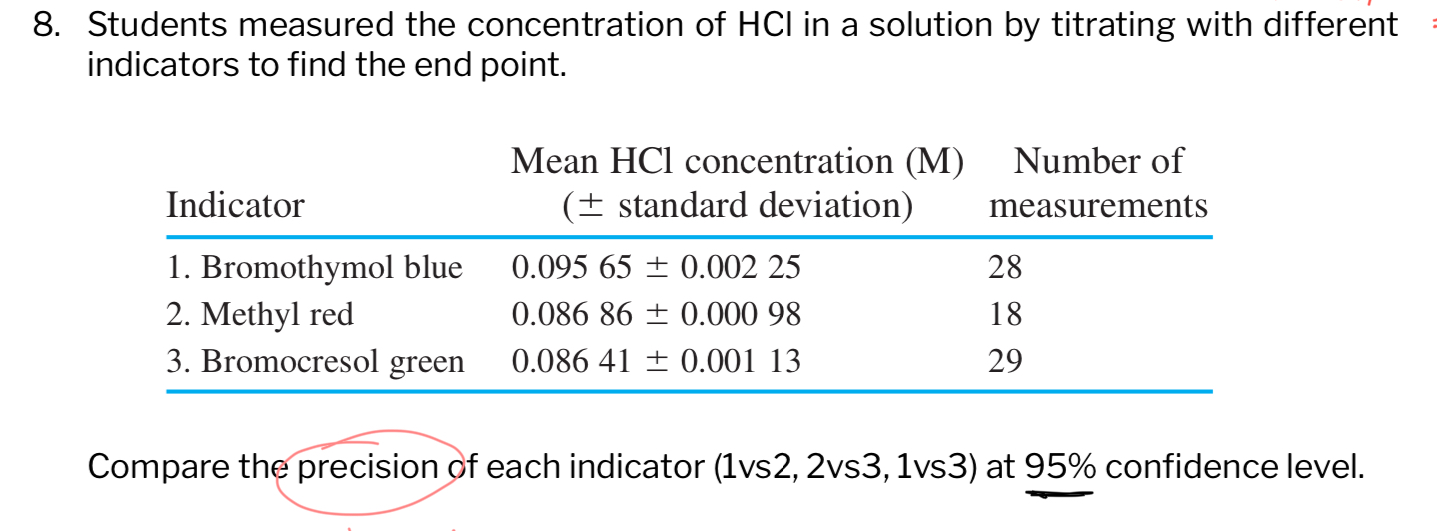
Compare the precision of each indicator (1 vs 2, 2 vs 3, 1 vs 3) at a 95% confidence level.
Understand the Problem
The question asks to compare the precision of three different indicators used in a titration experiment to determine the concentration of HCl. The comparison is made between each pair of indicators (1 vs 2, 2 vs 3, and 1 vs 3) at a 95% confidence level, using the provided mean concentrations, standard deviations, and number of measurements for each indicator.
Answer
Calculate and compare 95% confidence intervals (CI) for each indicator pair. Narrower CI indicates higher precision.
To compare precision, calculate the 95% confidence intervals (CI) for each indicator. A narrower CI indicates higher precision. Compare the CI ranges for each pair (1 vs 2, 2 vs 3, 1 vs 3); the indicator with the narrower range in each comparison is more precise.
Answer for screen readers
To compare precision, calculate the 95% confidence intervals (CI) for each indicator. A narrower CI indicates higher precision. Compare the CI ranges for each pair (1 vs 2, 2 vs 3, 1 vs 3); the indicator with the narrower range in each comparison is more precise.
More Information
The 95% confidence interval is a range of values that you can be 95% certain contains the true mean of the population. A smaller range indicates higher precision because the estimated values are more closely clustered around the mean.
Tips
Ensure you use the correct t-value or z-score for the 95% confidence level and the appropriate degrees of freedom when calculating the confidence intervals.
Sources
- Using Confidence Intervals to Compare Means - Statistics By Jim - statisticsbyjim.com
- Confidence interval - Biochemia Medica - biochemia-medica.com
AI-generated content may contain errors. Please verify critical information