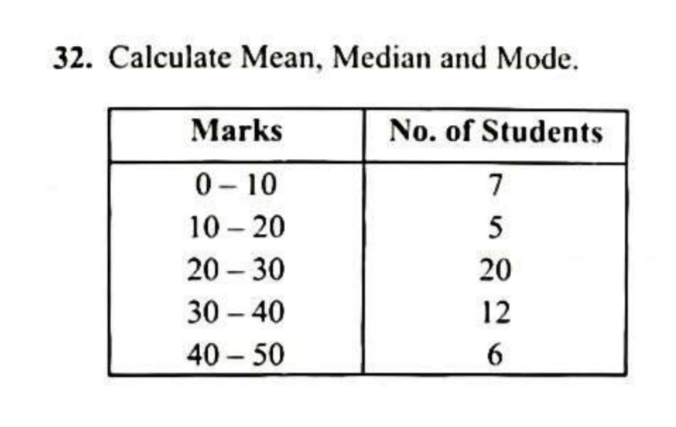
Calculate the mean, median, and mode for the following data: Marks No. of Students 0-10 7 10-20 5 20-30 20 30-40 12 40-50 6
Understand the Problem
The question asks us to calculate the mean, median, and mode for a given data set. The data is presented in the form of class intervals (marks) and their corresponding frequencies (number of students). This involves using the appropriate formulas for grouped data to find these measures of central tendency.
Answer
Mean = $26$ Median = $26.5$ Mode = $26.52$
Answer for screen readers
Mean = $26$ Median = $26.5$ Mode = $26.52$
Steps to Solve
- Calculate the midpoints of each class interval
The midpoint is the average of the upper and lower limits of each class. For example, for the first class (0-10), the midpoint is $(0+10)/2 = 5$. We repeat this for all classes.
| Class | Midpoint ($x_i$) | Frequency ($f_i$) |
|---|---|---|
| 0-10 | 5 | 7 |
| 10-20 | 15 | 5 |
| 20-30 | 25 | 20 |
| 30-40 | 35 | 12 |
| 40-50 | 45 | 6 |
- Calculate the mean
The formula for the mean of grouped data is:
$$ \text{Mean} = \frac{\sum f_i x_i}{\sum f_i} $$
First, calculate $f_i x_i$ for each class:
| Class | Midpoint ($x_i$) | Frequency ($f_i$) | $f_i x_i$ |
|---|---|---|---|
| 0-10 | 5 | 7 | 35 |
| 10-20 | 15 | 5 | 75 |
| 20-30 | 25 | 20 | 500 |
| 30-40 | 35 | 12 | 420 |
| 40-50 | 45 | 6 | 270 |
Now, sum the $f_i x_i$ values:
$$ \sum f_i x_i = 35 + 75 + 500 + 420 + 270 = 1300 $$
Next, sum the frequencies:
$$ \sum f_i = 7 + 5 + 20 + 12 + 6 = 50 $$
Finally, calculate the mean:
$$ \text{Mean} = \frac{1300}{50} = 26 $$
- Calculate the median
The formula for the median of grouped data is:
$$ \text{Median} = L + \frac{\frac{N}{2} - cf}{f} \times h $$
Where: $L$ = Lower boundary of the median class $N$ = Total frequency $cf$ = Cumulative frequency of the class preceding the median class $f$ = Frequency of the median class $h$ = Class width
First, calculate $N/2 = 50/2 = 25$. Now we need to find the median class. We calculate the cumulative frequencies:
| Class | Frequency ($f_i$) | Cumulative Frequency ($cf$) |
|---|---|---|
| 0-10 | 7 | 7 |
| 10-20 | 5 | 12 |
| 20-30 | 20 | 32 |
| 30-40 | 12 | 44 |
| 40-50 | 6 | 50 |
The median class is the class where the cumulative frequency is just greater than $N/2 = 25$, which is the 20-30 class.
$L = 20$ (Lower boundary of the median class) $N = 50$ $cf = 12$ (Cumulative frequency of the class preceding the median class) $f = 20$ (Frequency of the median class) $h = 10$ (Class width)
$$ \text{Median} = 20 + \frac{25 - 12}{20} \times 10 $$ $$ \text{Median} = 20 + \frac{13}{20} \times 10 $$ $$ \text{Median} = 20 + 6.5 = 26.5 $$
- Calculate the mode
The formula for the mode of grouped data is:
$$ \text{Mode} = L + \frac{f_1 - f_0}{2f_1 - f_0 - f_2} \times h $$
Where: $L$ = Lower boundary of the modal class $f_1$ = Frequency of the modal class $f_0$ = Frequency of the class preceding the modal class $f_2$ = Frequency of the class succeeding the modal class $h$ = Class width
The modal class is the class with the highest frequency, which is 20-30.
$L = 20$ (Lower boundary of the modal class) $f_1 = 20$ (Frequency of the modal class) $f_0 = 5$ (Frequency of the class preceding the modal class) $f_2 = 12$ (Frequency of the class succeeding the modal class) $h = 10$ (Class width)
$$ \text{Mode} = 20 + \frac{20 - 5}{2(20) - 5 - 12} \times 10 $$ $$ \text{Mode} = 20 + \frac{15}{40 - 17} \times 10 $$ $$ \text{Mode} = 20 + \frac{15}{23} \times 10 $$ $$ \text{Mode} = 20 + \frac{150}{23} \approx 20 + 6.52 = 26.52 $$
Mean = $26$ Median = $26.5$ Mode = $26.52$
More Information
The measures of central tendency give us an idea about the typical value in the dataset. In this case, the mean, median, and mode are quite close, indicating a relatively symmetrical distribution of marks.
Tips
- Forgetting to use the correct formulas for grouped data.
- Incorrectly identifying the median or modal class.
- Making errors in arithmetic calculations.
- Confusing the cumulative frequency with the regular frequency when calculating the median.
AI-generated content may contain errors. Please verify critical information