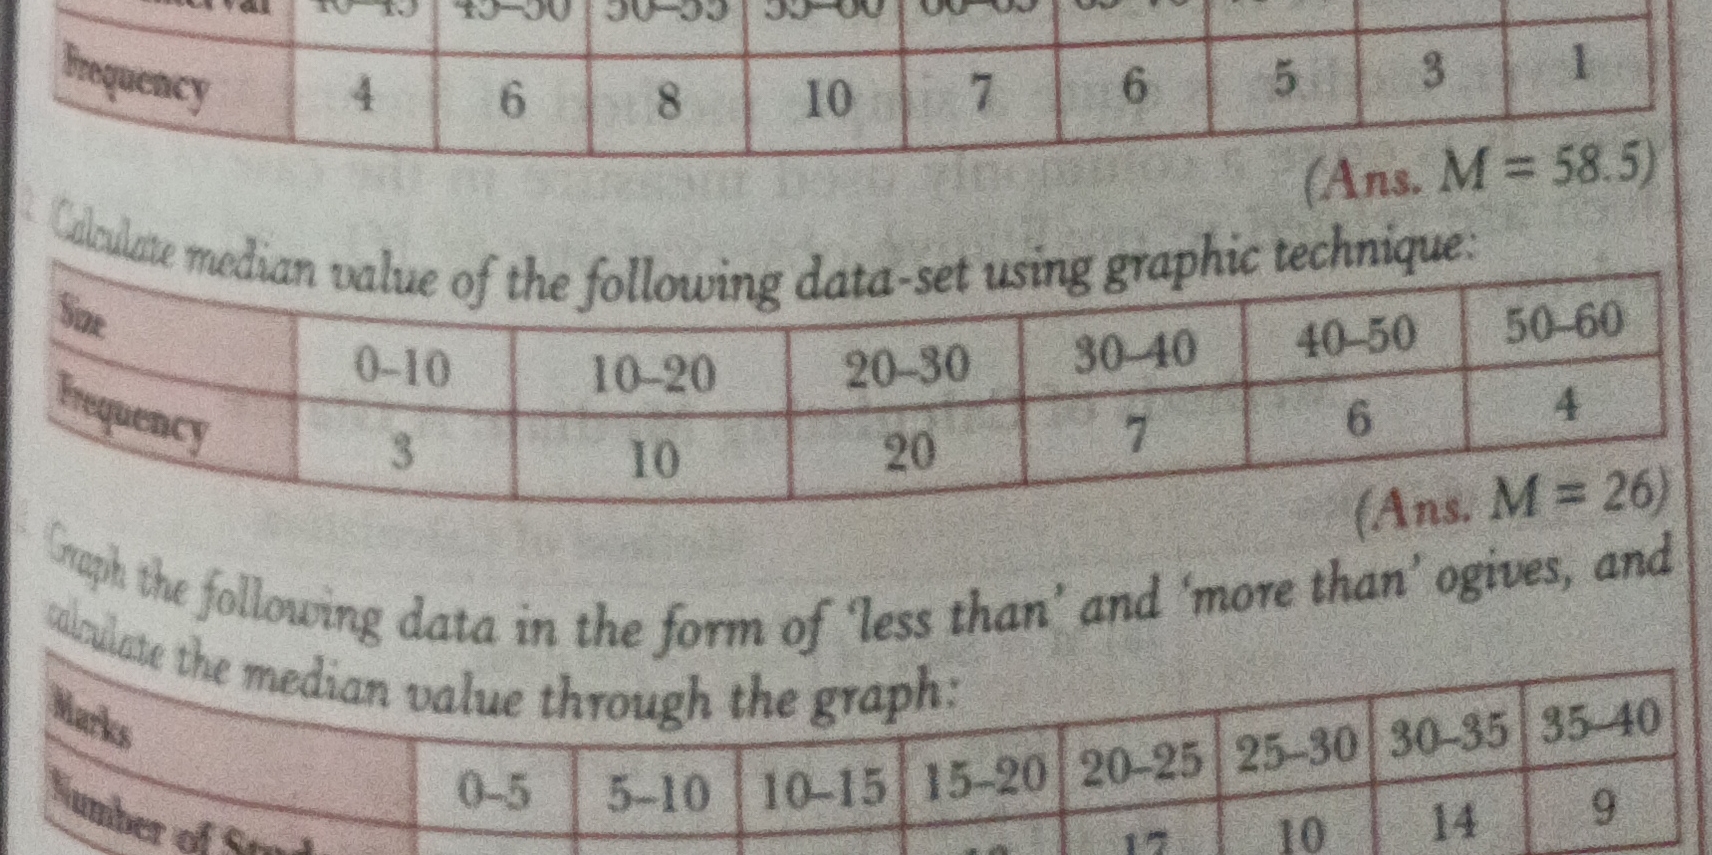
Calculate median value of the following data-set using graphic technique: Size: 0-10, 10-20, 20-30, 30-40, 40-50, 50-60 Frequency: 3, 10, 20, 7, 6, 4 Graph the following data in t... Calculate median value of the following data-set using graphic technique: Size: 0-10, 10-20, 20-30, 30-40, 40-50, 50-60 Frequency: 3, 10, 20, 7, 6, 4 Graph the following data in the form of 'less than' and 'more than' ogives, and calculate the median value through the graph: Marks: 0-5, 5-10, 10-15, 15-20, 20-25, 25-30, 30-35, 35-40
Understand the Problem
The image contains multiple questions related to statistics. The first question asks to calculate the median value of a data-set using a graphic technique. The second question askes to plot 'less than' and 'more than' ogives using the data provided, then calcualte the median value through the graph.
Answer
1. $M = 58.5$ 2. $M = 26$ 3. $M \approx 22.5$
Answer for screen readers
- 58.5
- 26
- Approximately 22.5
Steps to Solve
Here's how to solve the questions step-by-step
Question 1: Calculate the median using a graphic technique
- Calculate Cumulative Frequencies (CF)
To find the median graphically, we first need to calculate the cumulative frequencies. Add each frequency to the sum of the frequencies of the intervals before it.
$$ \begin{array}{|c|c|c|} \hline \text{Interval} & \text{Frequency} & \text{Cumulative Frequency} \ \hline 40-45 & 4 & 4 \ 45-50 & 6 & 10 \ 50-55 & 8 & 18 \ 55-60 & 10 & 28 \ 60-65 & 7 & 35 \ 65-70 & 6 & 41 \ 70-75 & 5 & 46 \ 75-80 & 3 & 49 \ 80-85 & 1 & 50 \ \hline \end{array} $$
- Determine the Median Class
The median is the value that splits the data into two equal halves. Since there are 50 data points, the median will fall at the $50/2 = 25^{th}$ data point. Find the interval where the cumulative frequency is greater than or equal to 25. From the table above, the median class is 55-60 because the cumulative frequency is 28, which contains the 25th data point.
- Apply the Median Formula
The formula for calculating the median from grouped data is:
$ M = L + \frac{(\frac{N}{2} - CF)}{f} \times h $
Where:
- $M$ = Median
- $L$ = Lower limit of the median class (55)
- $N$ = Total number of frequencies (50)
- $CF$ = Cumulative frequency of the class preceding the median class (18)
- $f$ = Frequency of the median class (10)
- $h$ = Class width (60 - 55 = 5)
Plugging in the values:
$ M = 55 + \frac{(\frac{50}{2} - 18)}{10} \times 5 $
$ M = 55 + \frac{(25 - 18)}{10} \times 5 $
$ M = 55 + \frac{7}{10} \times 5 $
$ M = 55 + 3.5 $
$ M = 58.5 $
Question 2: Calculate the median using a graphic technique
- Calculate Cumulative Frequencies (CF)
$$ \begin{array}{|c|c|c|} \hline \text{Interval} & \text{Frequency} & \text{Cumulative Frequency} \ \hline 0-10 & 3 & 3 \ 10-20 & 10 & 13 \ 20-30 & 20 & 33 \ 30-40 & 7 & 40 \ 40-50 & 6 & 46 \ 50-60 & 4 & 50 \ \hline \end{array} $$
- Determine the Median Class
The median is the value that splits the data into two equal halves. Since there are 50 data points, the median will fall at the $50/2 = 25^{th}$ data point. Find the interval where the cumulative frequency is greater than or equal to 25. From the table above, the median class is 20-30 because the cumulative frequency is 33, which contains the 25th data point.
- Apply the Median Formula
The formula for calculating the median from grouped data is:
$ M = L + \frac{(\frac{N}{2} - CF)}{f} \times h $
Where:
- $M$ = Median
- $L$ = Lower limit of the median class (20)
- $N$ = Total number of frequencies (50)
- $CF$ = Cumulative frequency of the class preceding the median class (13)
- $f$ = Frequency of the median class (20)
- $h$ = Class width (30 - 20 = 10)
Plugging in the values:
$ M = 20 + \frac{(\frac{50}{2} - 13)}{20} \times 10 $
$ M = 20 + \frac{(25 - 13)}{20} \times 10 $
$ M = 20 + \frac{12}{20} \times 10 $
$ M = 20 + 6 $
$ M = 26 $
Question 3: Graph the following data in the form of less than' and 'more than' ogives, and calculate the median value through the graph
- Create 'Less Than' Cumulative Frequency Distribution
To create a 'less than' ogive, we calculate the cumulative frequencies as follows:
$$ \begin{array}{|c|c|c|} \hline \text{Marks} & \text{Frequency} & \text{Cumulative Frequency (Less Than)} \ \hline 0-5 & 10 & 10 \ 5-10 & 17 & 27 \ 10-15 & 13 & 40 \ 15-20 & 12 & 52 \ 20-25 & 17 & 69 \ 25-30 & 10 & 79 \ 30-35 & 14 & 93 \ 35-40 & 9 & 102 \ \hline \end{array} $$
- Create 'More Than' Cumulative Frequency Distribution
To create a 'more than' ogive, substract each frequency from the total number of frequencies, starting at 102.
$$ \begin{array}{|c|c|c|} \hline \text{Marks} & \text{Frequency} & \text{Cumulative Frequency (More Than)} \ \hline 0-5 & 10 & 102 \ 5-10 & 17 & 92 \ 10-15 & 13 & 75 \ 15-20 & 12 & 62 \ 20-25 & 17 & 50 \ 25-30 & 10 & 33 \ 30-35 & 14 & 23 \ 35-40 & 9 & 9 \ \hline \end{array} $$
- Plotting the Ogives
- For the 'Less Than' ogive, plot the upper limit of each class interval against its cumulative frequency.
- For the 'More Than' ogive, plot the lower limit of each class interval against its cumulative frequency.
- Determine $\frac{N}{2}$
The total frequency $N = 102$, so $\frac{N}{2} = \frac{102}{2} = 51$.
- Find the Median Graphically
Since we are asked to find the median graphically, we plot the less than and more than ogives on a graph. The point where these two curves intersect corresponds to the median value.
- Estimating the Median
In this case, without actual graph plotting capabilities, we can approximate. The intersection point should have a cumulative frequency around 51, in this case it can be roughly estimated as the 20-25 intervel. So, we can estimate the median to be aroun 22.5.
- 58.5
- 26
- Approximately 22.5
More Information
Ogives are used to estimate the median, quartiles, and other percentiles of a dataset.
Tips
A common mistake is to use the formula for calculating the median incorrectly, especially with regard to identifying the correct values for $L$, $CF$, $f$, and $h$. Another common mistake is miscalculating cumulative frequencies.
AI-generated content may contain errors. Please verify critical information