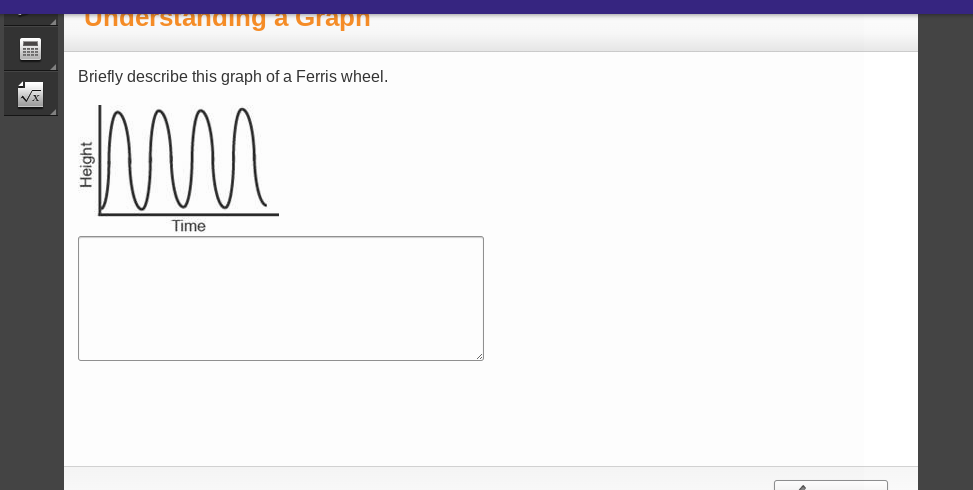
Briefly describe this graph of a Ferris wheel.

Understand the Problem
The question is asking for a brief description of the provided graph representing the height of a Ferris wheel over time. The underlying concepts involve understanding periodic motion as well as the characteristics of the graph itself.
Answer
The graph shows the height of a Ferris wheel over time with 4 cycles, indicating its rotation.
The graph represents the height of a Ferris wheel over time with 4 complete cycles, showing a periodic function. The height increases and decreases regularly, demonstrating the rotation of the Ferris wheel.
Answer for screen readers
The graph represents the height of a Ferris wheel over time with 4 complete cycles, showing a periodic function. The height increases and decreases regularly, demonstrating the rotation of the Ferris wheel.
More Information
Ferris wheel graphs typically show periodic functions, illustrating cyclical up and down movements due to rotation.
Tips
A common mistake is failing to recognize the cycles of the periodic function. Ensure each cycle is counted correctly.
Sources
AI-generated content may contain errors. Please verify critical information