Based on the provided graph and information about agricultural production in Brazil:
Understand the Problem
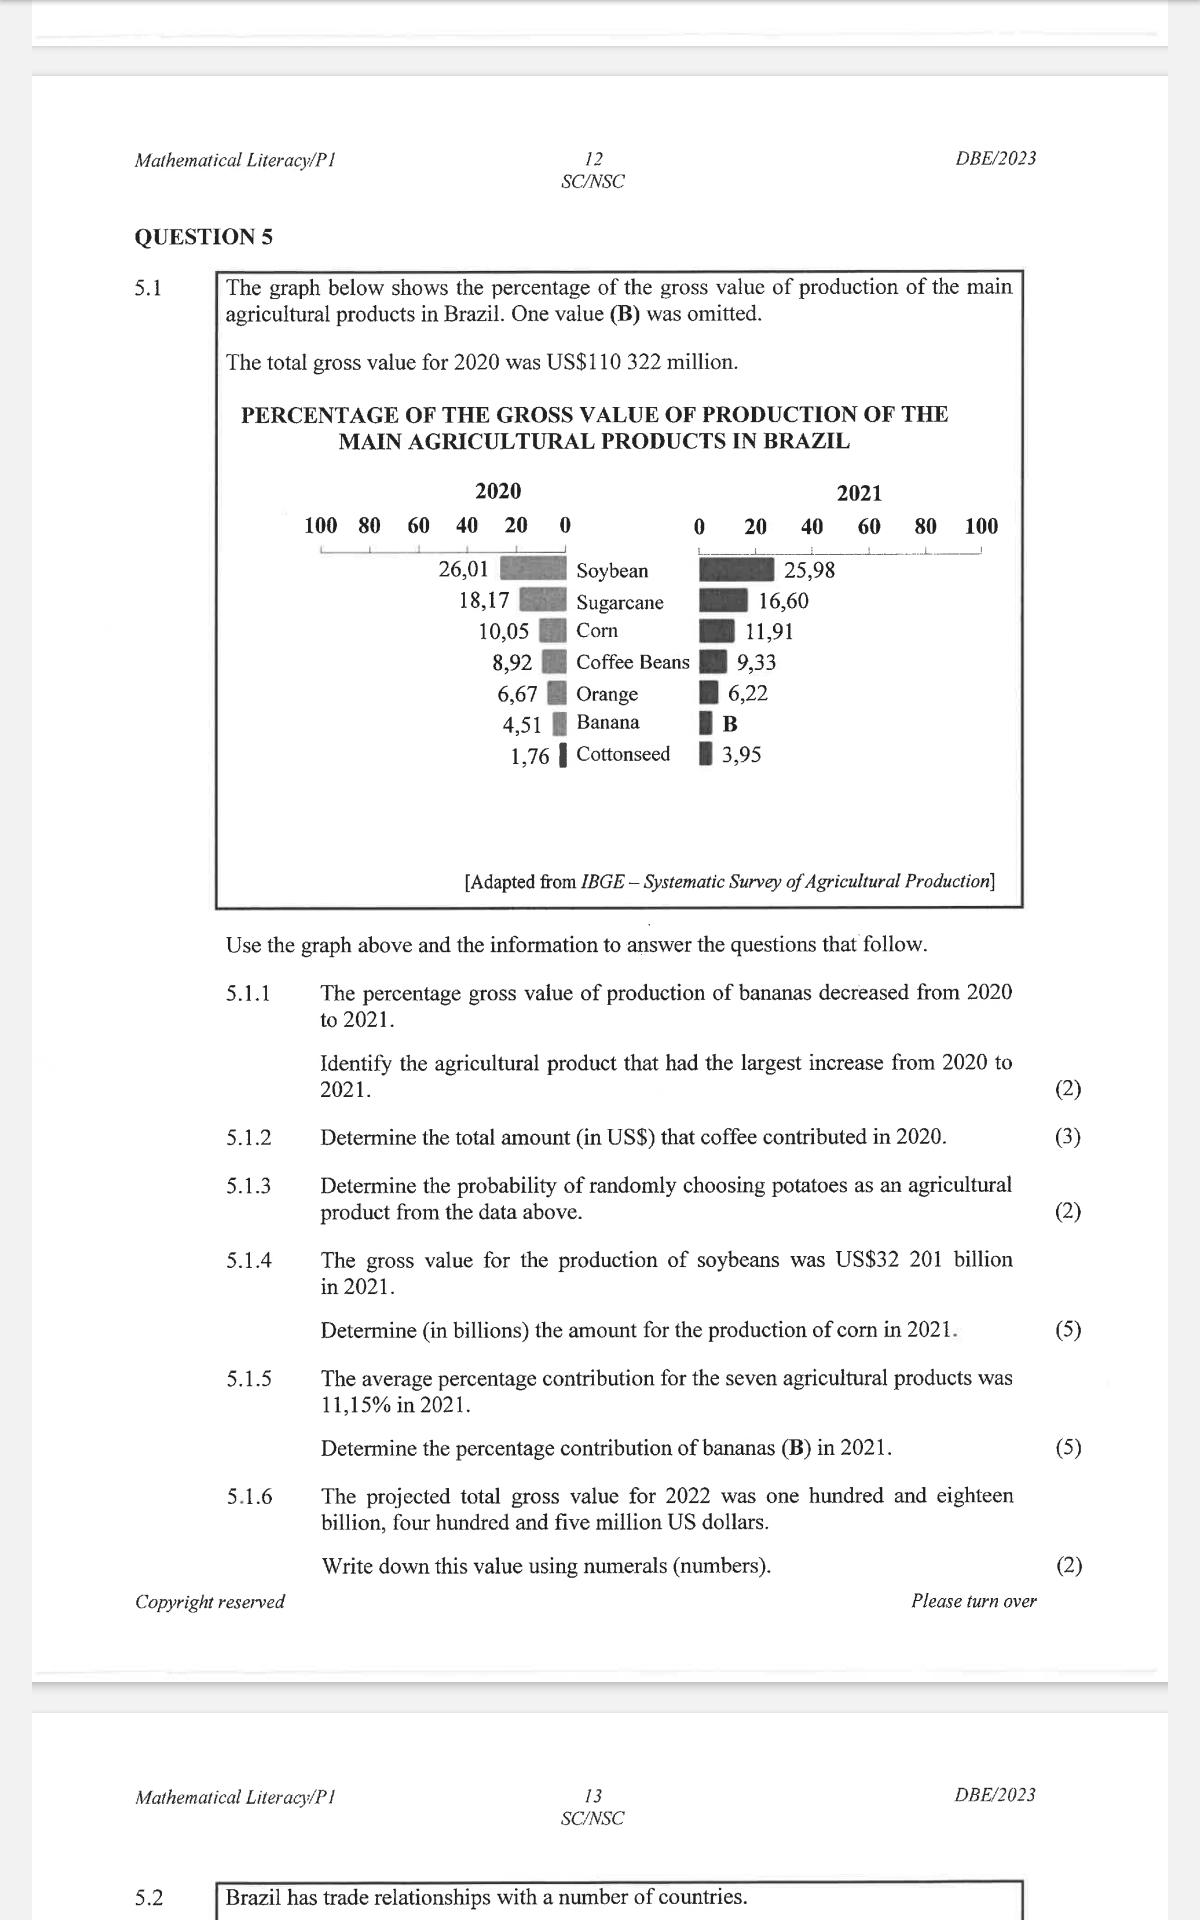
The image presents a set of math questions related to a graph illustrating the percentage of gross value of production of main agricultural products in Brazil for the years 2020 and 2021. The questions require analyzing the graph, performing calculations, and interpreting the data to find values such as percentage decreases and the total amount contributed by coffee in 2020.
Answer
5.1.1 Corn 5.1.2 $9,837,578.40$ 5.1.3 $0$ 5.1.4 $14.77$ 5.1.5 $34.25\%$ 5.1.6 $118,405,000,000$
Answer for screen readers
5.1.1 Corn 5.1.2 $9,837,578.40$ 5.1.3 $0$ 5.1.4 $14.77$ 5.1.5 $34.25%$ 5.1.6 $118,405,000,000$
Steps to Solve
- Identify the agricultural product with the largest increase Examine the graph to find the agricultural product with the greatest percentage increase from 2020 to 2021.
- Calculate the total amount contributed by coffee in 2020 Multiply the total gross value for 2020 by the percentage contribution of coffee in 2020. $$ \text{Coffee contribution} = \text{Total gross value} \times \text{Coffee percentage} $$ $$ \text{Coffee contribution} = 110,322 \text{ million} \times 8.92% $$ $$ \text{Coffee contribution} = 110,322 \times 0.0892 \text{ million} $$
- Determine the probability of choosing potatoes Since potatoes are not listed in the data, the probability of choosing potatoes is 0.
- Calculate the amount for corn production in 2021 First, calculate the total gross value for 2021, using the soybean value and percentage: $$ \text{Total gross value 2021} = \frac{\text{Soybean value}}{\text{Soybean percentage}} $$ $$ \text{Total gross value 2021} = \frac{32.201 \text{ billion}}{25.98%} = \frac{32.201}{0.2598} \text{ billion} $$ Then, calculate the corn production value in 2021 using the total gross value for 2021 and the corn percentage. $$ \text{Corn value} = \text{Total gross value 2021} \times \text{Corn percentage} $$ $$ \text{Corn value} = \frac{32.201}{0.2598} \times 11.91% \text{ billion} $$ $$ \text{Corn value} = \frac{32.201}{0.2598} \times 0.1191 \text{ billion} $$
- Determine the percentage contribution of bananas in 2021 Calculate the sum of the known percentages in 2021. $$ \text{Sum of known percentages} = 25.98 + 16.60 + 11.91 + 9.33 + 6.22 + 3.95 + 1.76 $$ Subtract this sum from 100 to find the percentage contribution of bananas (B). $$ B = 100 - \text{Sum of known percentages} $$
- Write the projected total gross value for 2022 in numerals The value is one hundred and eighteen billion, four hundred and five million US dollars, which is written as $118,405,000,000$.
5.1.1 Corn 5.1.2 $9,837,578.40$ 5.1.3 $0$ 5.1.4 $14.77$ 5.1.5 $34.25%$ 5.1.6 $118,405,000,000$
More Information
The answers were calculated based on the provided graph and information. The coffee contribution in 2020 was found by multiplying the total gross value by the percentage contribution of coffee. The probability of choosing potatoes is zero because potatoes were not mentioned in the data. The corn production value was found by calculating the total gross value for 2021 based on the soybean value and percentage, then multiplying it by the corn percentage. The percentage contribution of bananas was found by subtracting the sum of other percentages from 100. Finally, the projected total gross value for 2022 was written in numerals.
Tips
- Forgetting to convert percentages to decimals when performing calculations.
- Including potatoes in the probability calculation (since it's not in the list, the probability is 0).
- Incorrectly calculating the total gross value for 2021.
- Making arithmetic errors during calculations.
- Not paying attention to units (millions vs. billions).
AI-generated content may contain errors. Please verify critical information