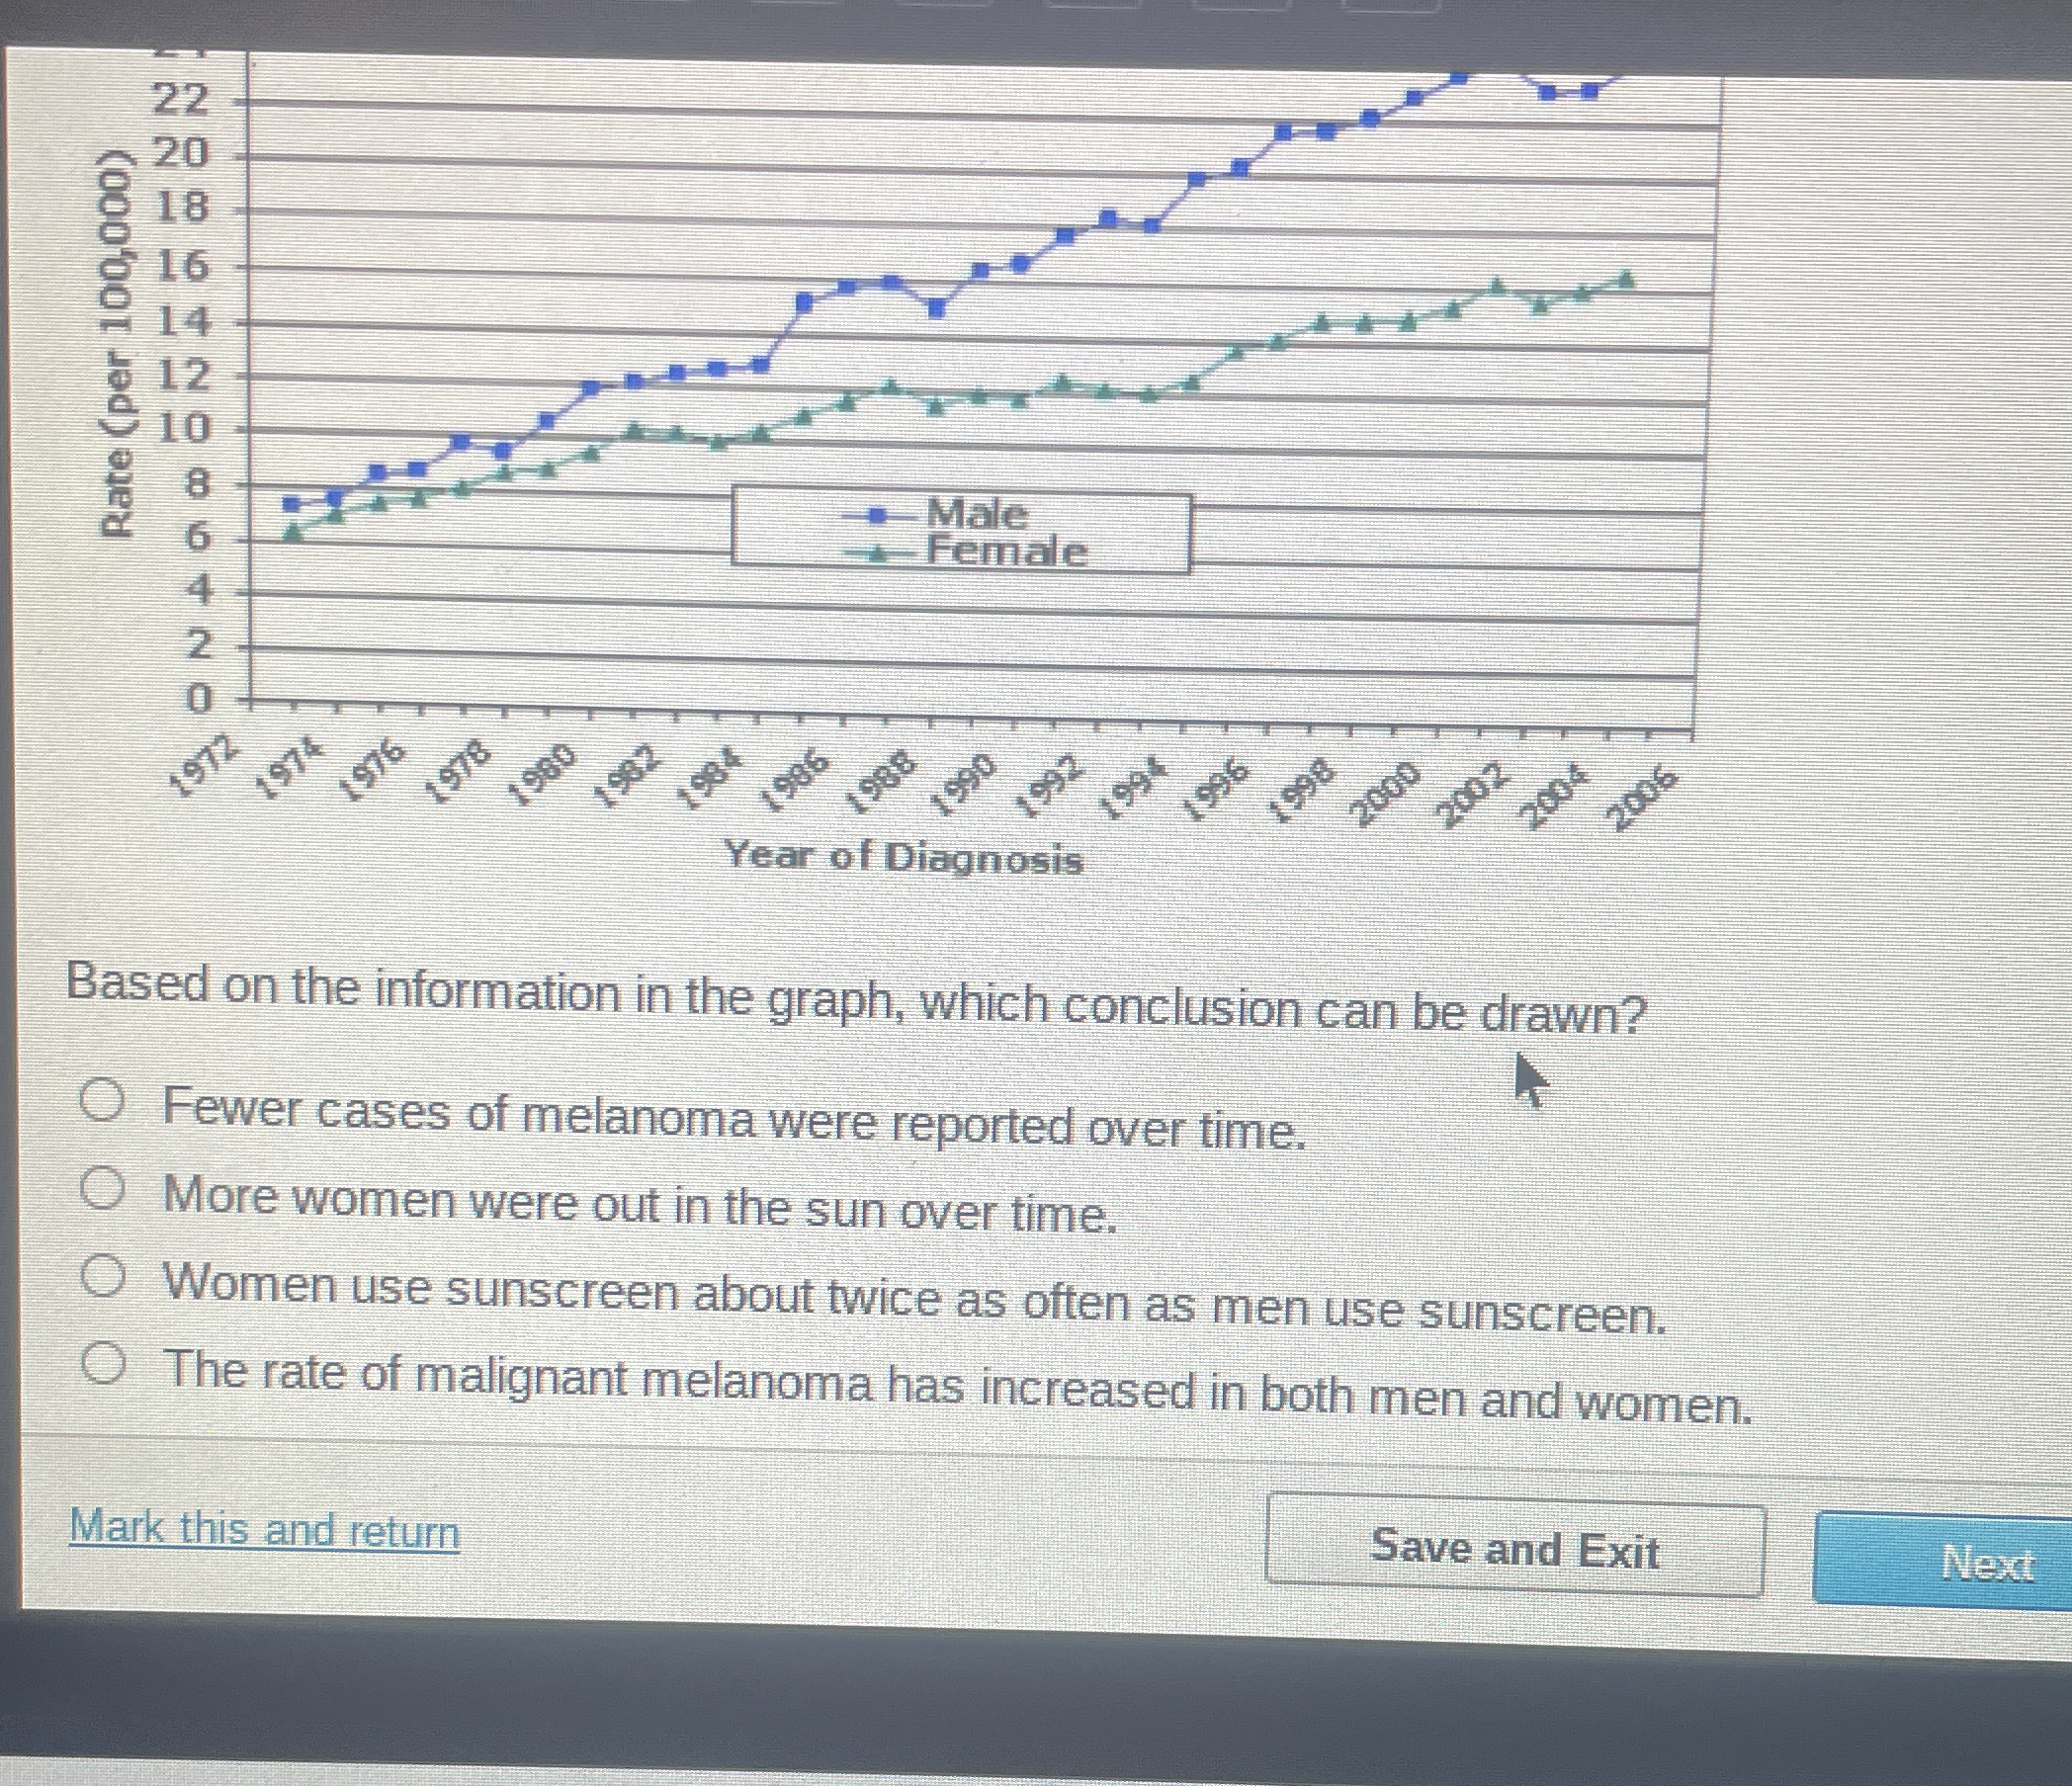
Based on the information in the graph, which conclusion can be drawn?

Understand the Problem
The question is asking for an interpretation of the graph related to melanoma rates over time, specifically which conclusion can be inferred based on the trends shown for males and females.
Answer
The rate of malignant melanoma has increased in both men and women.
The rate of malignant melanoma has increased in both men and women.
Answer for screen readers
The rate of malignant melanoma has increased in both men and women.
More Information
The graph shows a clear upward trend for both males and females from 1973 to 2006, indicating an increase in the incidence rates of malignant melanoma.
Tips
Be careful to focus on the data trends rather than external assumptions when interpreting a graph.
AI-generated content may contain errors. Please verify critical information