Attached image of a mass spectrum.
Understand the Problem
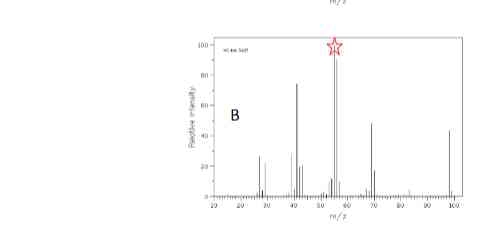
The image shows a mass spectrum. This type of question would typically require interpretation of the spectrum to identify the molecule or understand the fragmentation pattern. Without a specific question, I will classify this as miscellaneous. If a more specific question is asked with respect to this diagram, I will answer accordingly.
Answer
A is m/z, and B is relative intensity.
Based on the image of the mass spectrum, A is m/z, and B is relative intensity.
Answer for screen readers
Based on the image of the mass spectrum, A is m/z, and B is relative intensity.
More Information
In mass spectrometry, the x-axis of a mass spectrum represents the mass-to-charge ratio (m/z), while the y-axis represents the relative abundance or intensity of the ions detected.
Tips
Pay close attention to the axes labels on the spectrum.
Sources
- Mass Spectrum - an overview | ScienceDirect Topics - sciencedirect.com
- Mass Spectrometry Basics - Jeol USA - jeolusa.com
AI-generated content may contain errors. Please verify critical information