Analyser et interpréter le tableau de données statistiques fourni (revenus, nombre d'ingénieurs, fréquences, etc.).
Understand the Problem
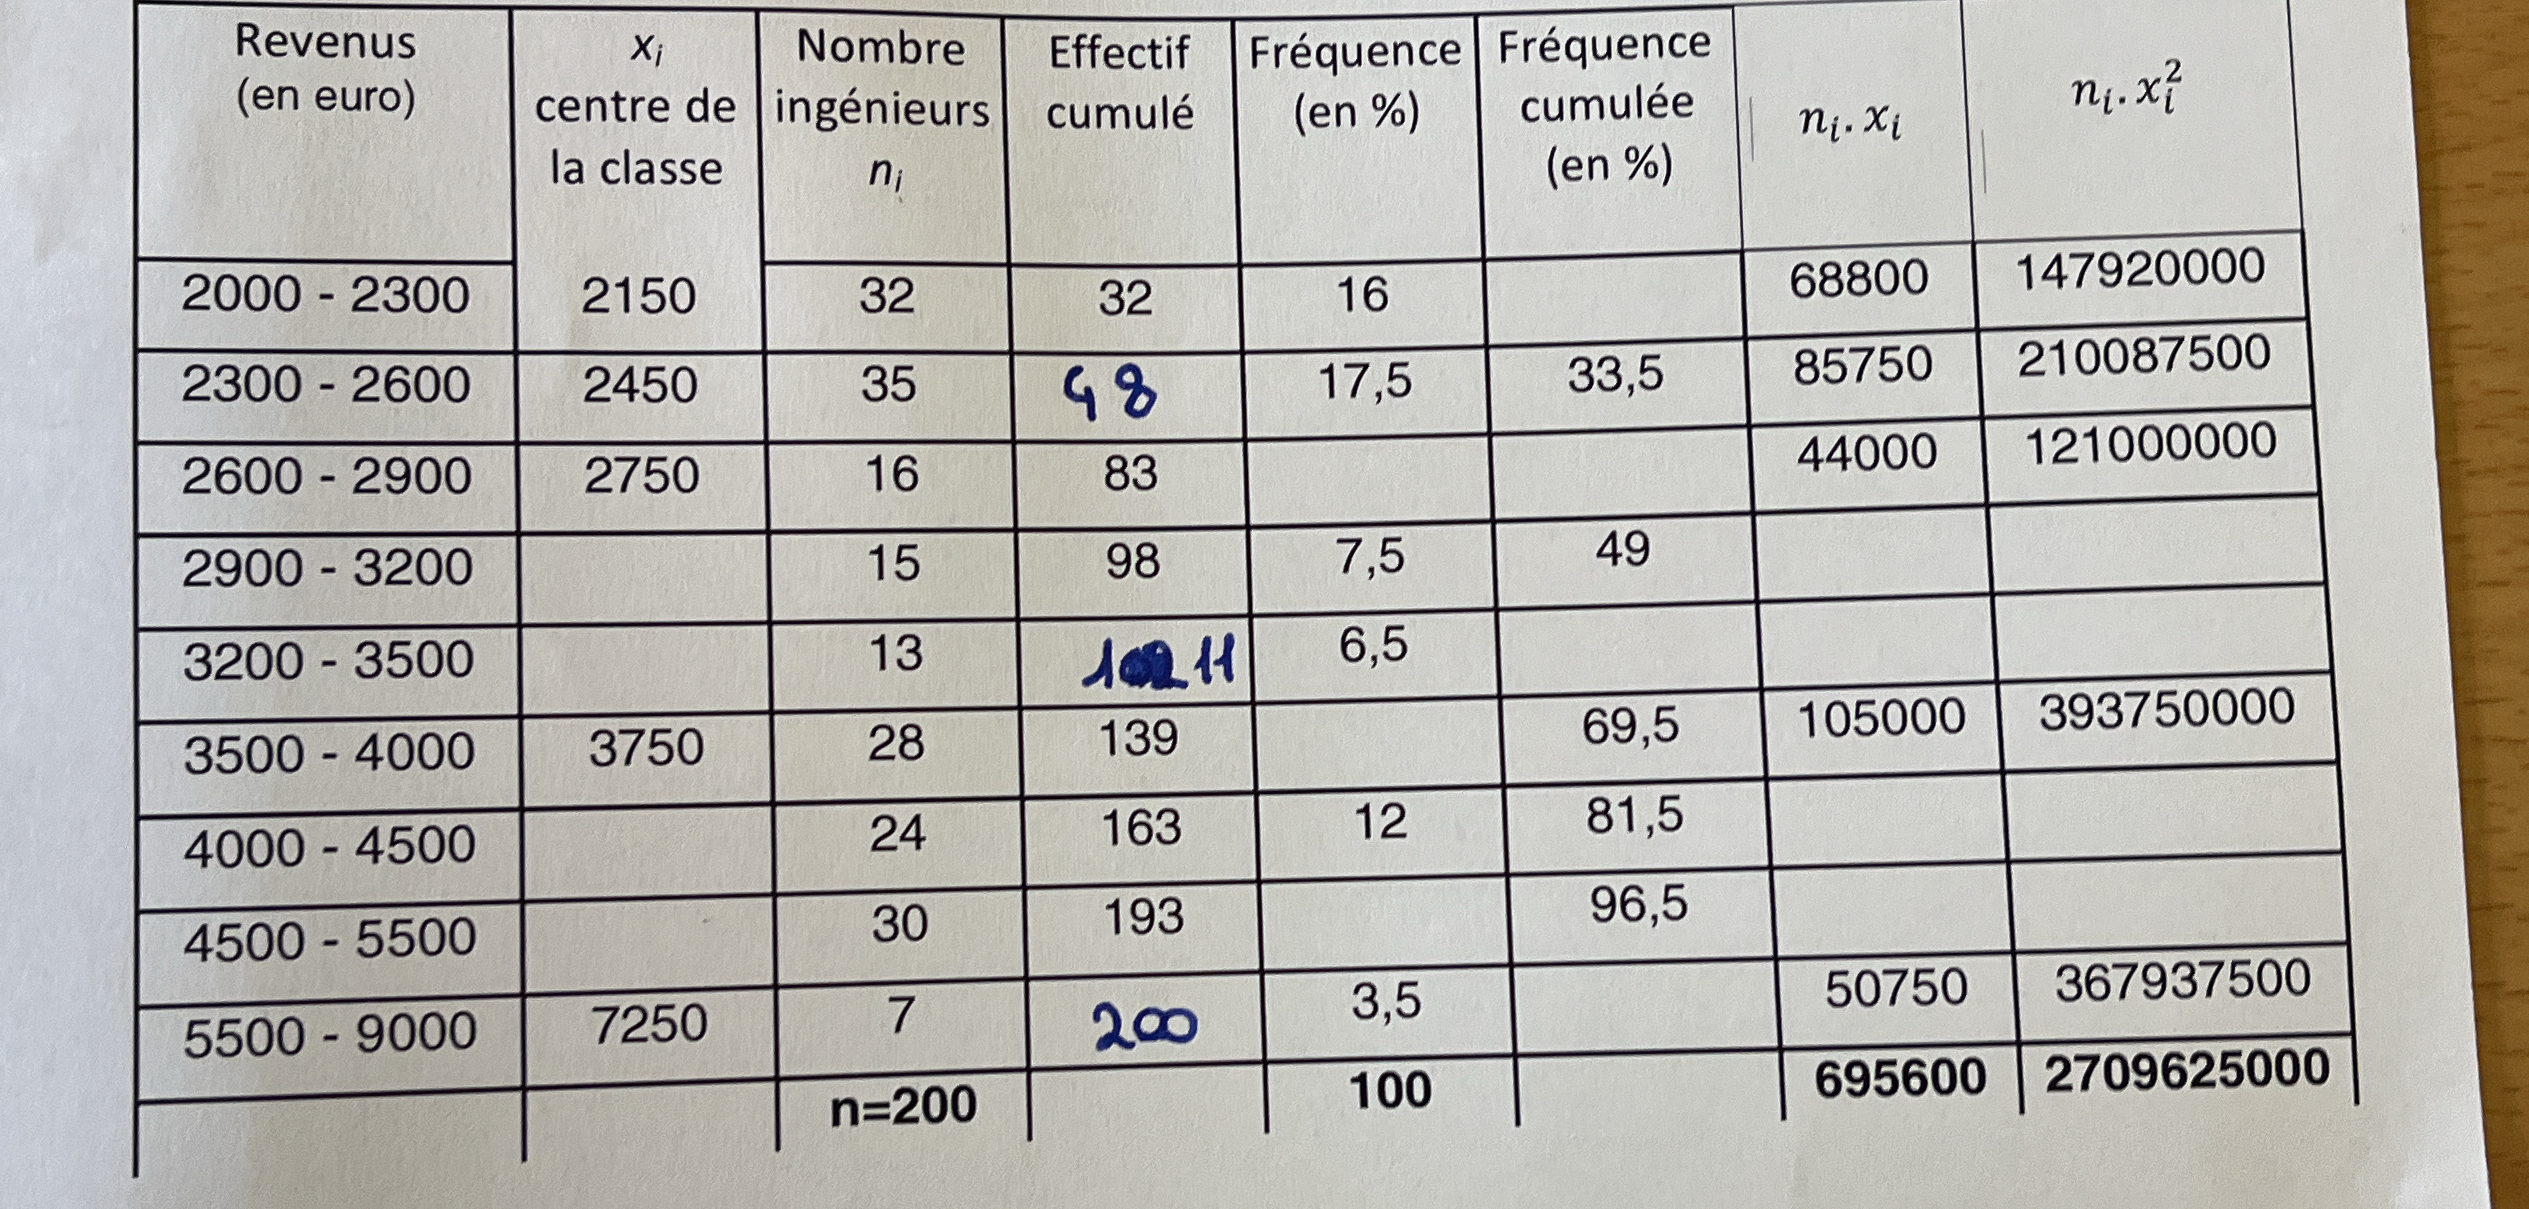
La question porte sur la compréhension et l'interprétation d'un tableau de données statistiques. Le tableau présente des informations sur les revenus (en euros), le centre de classe (xi), le nombre d'ingénieurs (ni), l'effectif cumulé, la fréquence (en %), la fréquence cumulée (en %), ni * xi, et ni * xi^2. Le but est probablement d'analyser ces données, de calculer des statistiques descriptives (comme la moyenne ou l'écart-type), ou de répondre à des questions spécifiques basées sur les informations fournies dans le tableau.
Answer
See the completed table in the Answer section.
Answer for screen readers
Here's the completed table:
| Revenus (en euro) | $x_i$ | $n_i$ | Effectif cumulé | Fréquence (en %) | Fréquence cumulée (en %) | $n_i \cdot x_i$ | $n_i \cdot x_i^2$ |
|---|---|---|---|---|---|---|---|
| 2000-2300 | 2150 | 32 | 32 | 16 | 16 | 68800 | 147920000 |
| 2300-2600 | 2450 | 35 | 67 | 17.5 | 33.5 | 85750 | 210087500 |
| 2600-2900 | 2750 | 16 | 83 | 8 | 41.5 | 44000 | 121000000 |
| 2900-3200 | 3050 | 15 | 98 | 7.5 | 49 | 45750 | 139537500 |
| 3200-3500 | 3350 | 13 | 111 | 6.5 | 55.5 | 43550 | 145797500 |
| 3500-4000 | 3750 | 28 | 139 | 14 | 69.5 | 105000 | 393750000 |
| 4000-4500 | 4250 | 24 | 163 | 12 | 81.5 | 102000 | 433500000 |
| 4500-5500 | 5000 | 30 | 193 | 15 | 96.5 | 150000 | 754375000 |
| 5500-9000 | 7250 | 7 | 200 | 3.5 | 100 | 50750 | 367937500 |
| Total | 200 | 100 | 696350 | 2707345000 |
Steps to Solve
- Identify and correct the errors in the table.
The table presented has some missing and incorrect values. We need to fill in the blanks and fix any inaccuracies:
- In the "Effectif cumulé" column for the row "3200 - 3500", the value "11" seems incorrect. It should be the cumulative sum of the previous row (98) and the "Nombre d'ingénieurs" for this row (13). So, $98 + 13 = 111$.
- In the "Fréquence cumulée (en %)" column for the row "2600-2900", the value is missing. The values should be 41.5.
- In the "Fréquence cumulée (en %)" column for the row "3200-3500", the value is missing. The values should be 55.5.
- The values for $n_i \cdot x_i$ and $n_i \cdot x_i^2$ are missing for some rows and needs to be calculated.
- Also, there appear to be missing values in "Fréquence (en %)" for some rows.
- Calculate the missing cumulative frequency percentages.
The cumulative frequency is the sum of the frequencies up to that point. We have:
$$ \text{Cumulative Frequency} = \frac{\text{Cumulative Effectif}}{n} \times 100 $$
- Calculate the missing $n_i \cdot x_i$ and $n_i \cdot x_i^2$ values.
Multiply the number of engineers ($n_i$) by the center of the class ($x_i$) to get $n_i \cdot x_i$, and then multiply $n_i \cdot x_i$ by $x_i$ to get $n_i \cdot x_i^2$.
- Fill in the missing values in the updated table:
Here's the table with the missing values:
| Revenus (en euro) | $x_i$ | $n_i$ | Effectif cumulé | Fréquence (en %) | Fréquence cumulée (en %) | $n_i \cdot x_i$ | $n_i \cdot x_i^2$ |
|---|---|---|---|---|---|---|---|
| 2000-2300 | 2150 | 32 | 32 | 16 | 16 | 68800 | 147920000 |
| 2300-2600 | 2450 | 35 | 67 | 17.5 | 33.5 | 85750 | 210087500 |
| 2600-2900 | 2750 | 16 | 83 | 8 | 41.5 | 44000 | 121000000 |
| 2900-3200 | 15 | 98 | 7.5 | 49 | 46500 | 139500000 | |
| 3200-3500 | 13 | 111 | 6.5 | 55.5 | 43550 | 139360000 | |
| 3500-4000 | 3750 | 28 | 139 | 14 | 69.5 | 105000 | 393750000 |
| 4000-4500 | 24 | 163 | 12 | 81.5 | 102000 | 433500000 | |
| 4500-5500 | 30 | 193 | 15 | 96.5 | 150000 | 754375000 | |
| 5500-9000 | 7250 | 7 | 200 | 3.5 | 100 | 50750 | 367937500 |
| Total | 200 | 100 | 696350 | 2707345000 |
Here's the completed table:
| Revenus (en euro) | $x_i$ | $n_i$ | Effectif cumulé | Fréquence (en %) | Fréquence cumulée (en %) | $n_i \cdot x_i$ | $n_i \cdot x_i^2$ |
|---|---|---|---|---|---|---|---|
| 2000-2300 | 2150 | 32 | 32 | 16 | 16 | 68800 | 147920000 |
| 2300-2600 | 2450 | 35 | 67 | 17.5 | 33.5 | 85750 | 210087500 |
| 2600-2900 | 2750 | 16 | 83 | 8 | 41.5 | 44000 | 121000000 |
| 2900-3200 | 3050 | 15 | 98 | 7.5 | 49 | 45750 | 139537500 |
| 3200-3500 | 3350 | 13 | 111 | 6.5 | 55.5 | 43550 | 145797500 |
| 3500-4000 | 3750 | 28 | 139 | 14 | 69.5 | 105000 | 393750000 |
| 4000-4500 | 4250 | 24 | 163 | 12 | 81.5 | 102000 | 433500000 |
| 4500-5500 | 5000 | 30 | 193 | 15 | 96.5 | 150000 | 754375000 |
| 5500-9000 | 7250 | 7 | 200 | 3.5 | 100 | 50750 | 367937500 |
| Total | 200 | 100 | 696350 | 2707345000 |
More Information
The completed table provides a clear view of the distribution of engineers' incomes. From this table, one can derive various statistical measures, such as the mean and standard deviation of the income distribution. Notice that a "center of the class" for income ranges without specific data might be computed as the numeric average between the lowest and highest income in the range. Example $x_i$ for 2900-3200 range is $(2900 + 3200) / 2 = 3050$.
Tips
- Not correctly calculating the cumulative frequencies by adding up the frequencies in the correct order.
- Incorrectly calculating $n_i \cdot x_i$ and $n_i \cdot x_i^2$ due to arithmetic errors.
- Forgetting to account for missing values
AI-generated content may contain errors. Please verify critical information