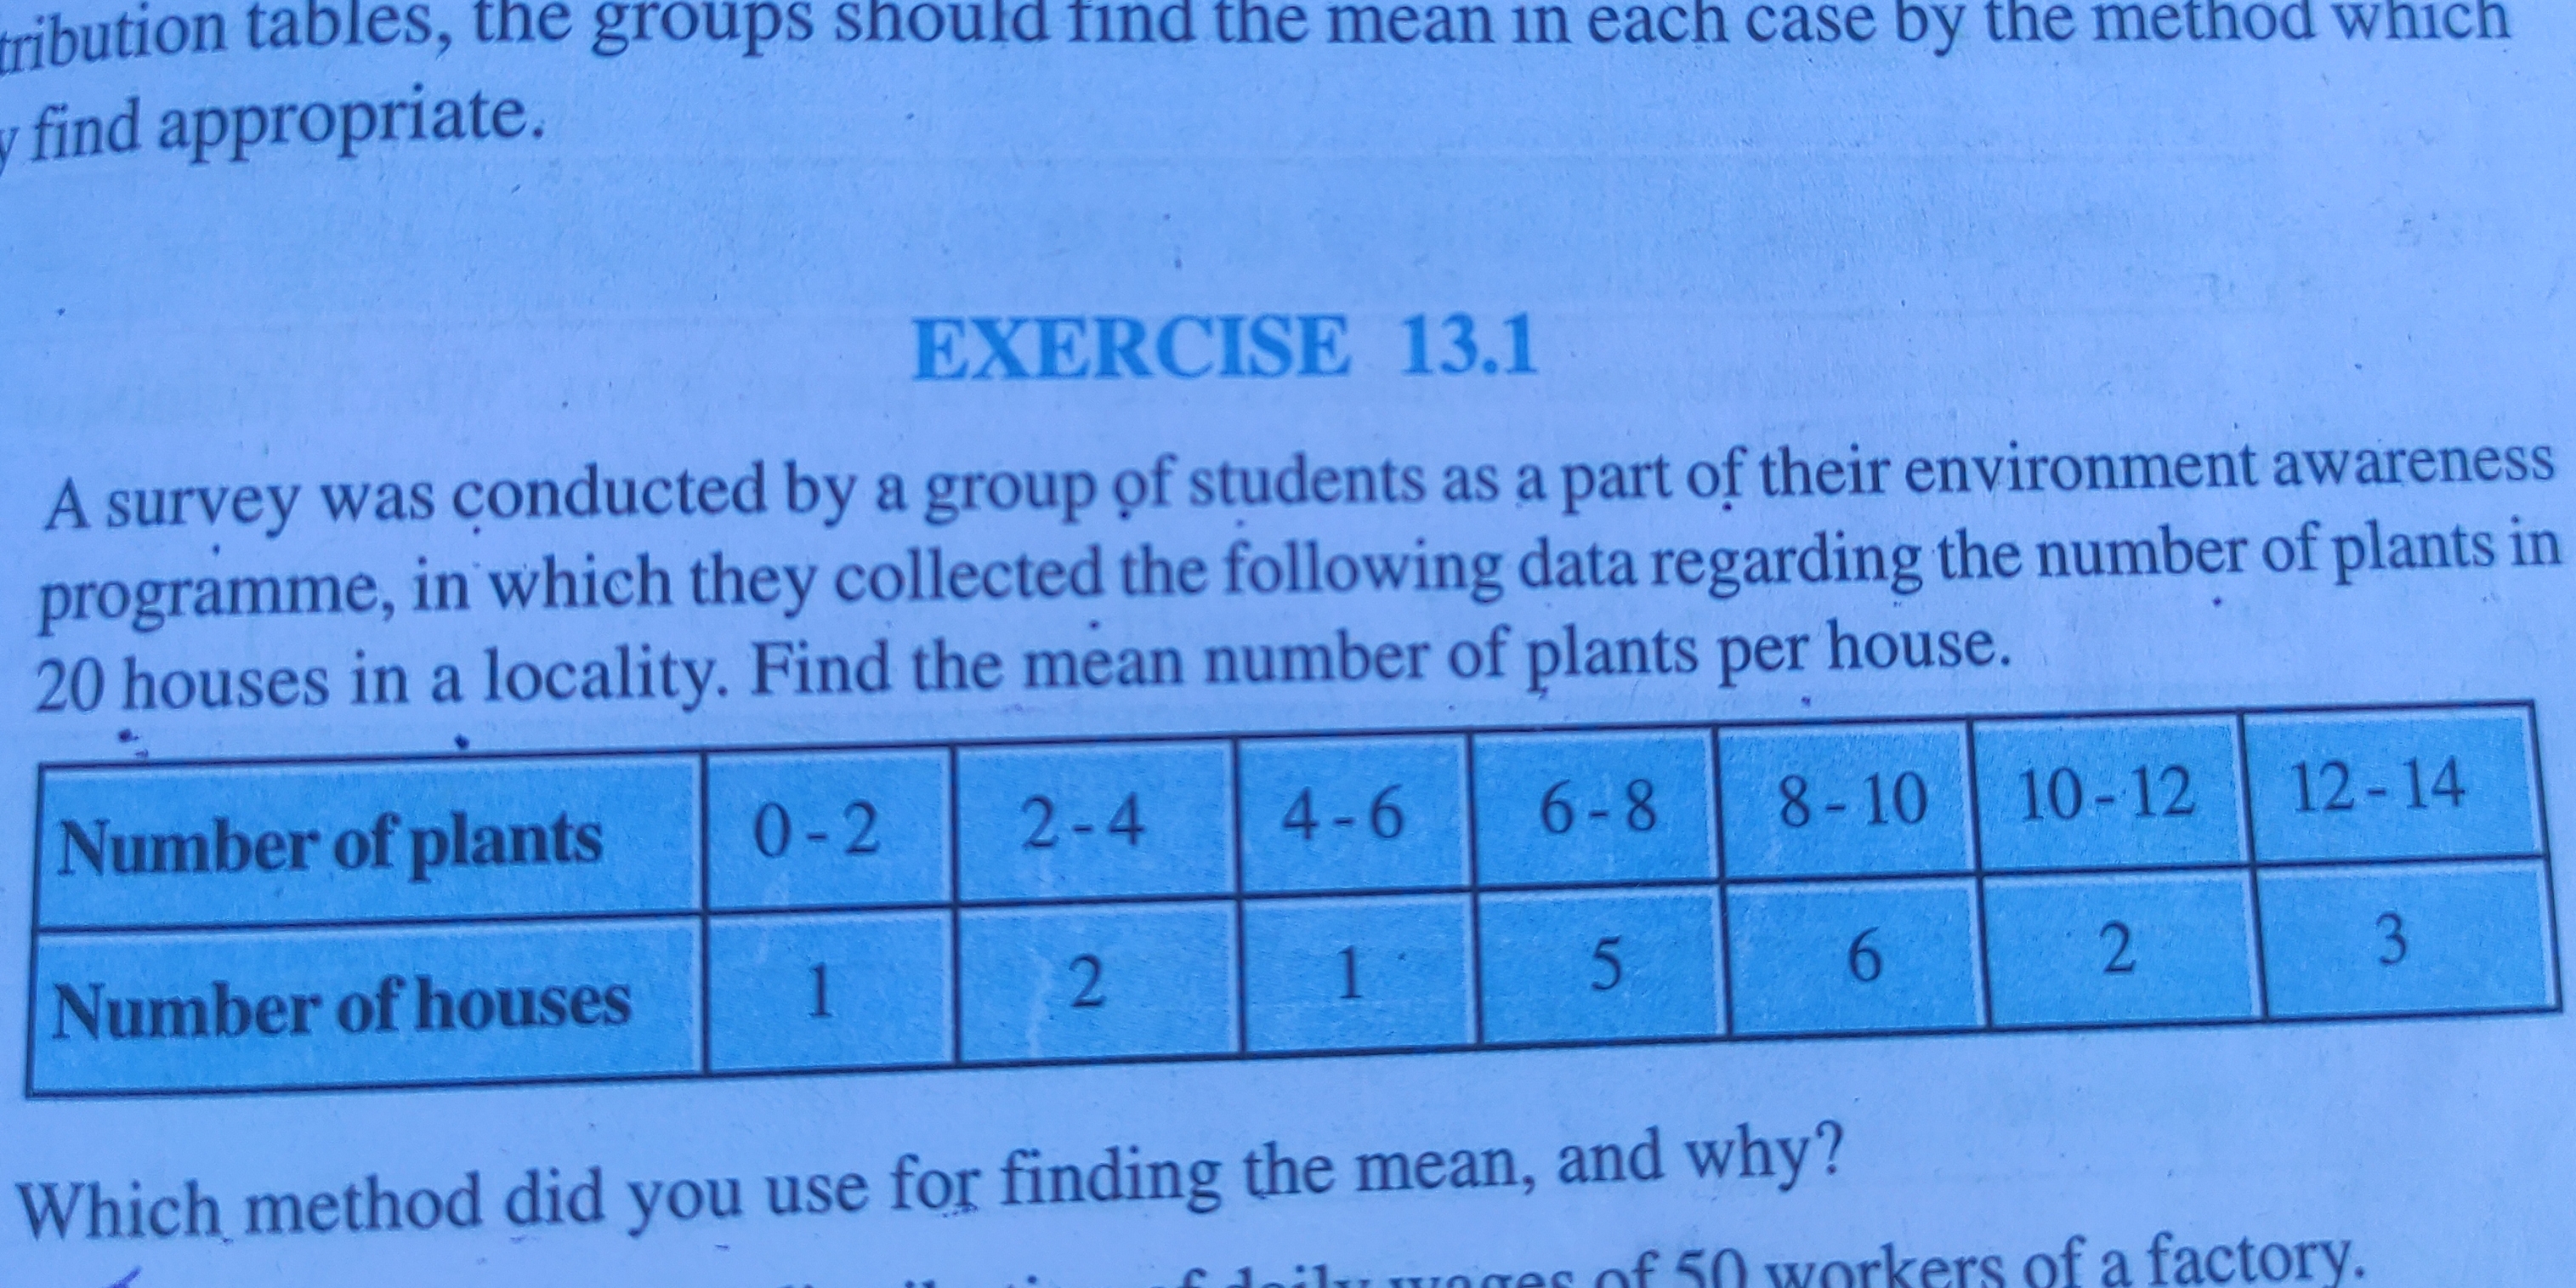
A survey was conducted by a group of students as a part of their environment awareness programme, in which they collected the following data regarding the number of plants in 20 ho... A survey was conducted by a group of students as a part of their environment awareness programme, in which they collected the following data regarding the number of plants in 20 houses in a locality. Find the mean number of plants per house. Which method did you use for finding the mean, and why?
Understand the Problem
The problem is a statistical question regarding finding the mean number of plants per house based on survey data. The data is provided in a frequency table showing the number of plants (in intervals) and the corresponding number of houses. We are asked to calculate the arithmetic mean. Also, the question asks which method did you use, if the question is solved by hand.
Answer
$8.1$
Answer for screen readers
The mean number of plants per house is $8.1$.
Steps to Solve
- Find the midpoint of each class interval
To calculate the mean from a frequency table with class intervals, we first need to find the midpoint of each interval. The midpoint is calculated as (lower limit + upper limit) / 2.
For the interval 0-2: $(0 + 2) / 2 = 1$ For the interval 2-4: $(2 + 4) / 2 = 3$ For the interval 4-6: $(4 + 6) / 2 = 5$ For the interval 6-8: $(6 + 8) / 2 = 7$ For the interval 8-10: $(8 + 10) / 2 = 9$ For the interval 10-12: $(10 + 12) / 2 = 11$ For the interval 12-14: $(12 + 14) / 2 = 13$
- Multiply the midpoint by the frequency for each interval
Multiply each midpoint by the corresponding number of houses (frequency).
$1 \times 1 = 1$ $3 \times 2 = 6$ $5 \times 1 = 5$ $7 \times 5 = 35$ $9 \times 6 = 54$ $11 \times 2 = 22$ $13 \times 3 = 39$
- Sum the products obtained in the previous step
Add all the products calculated in step 2.
$1 + 6 + 5 + 35 + 54 + 22 + 39 = 162$
- Sum the frequencies
Add the number of houses (frequencies).
$1 + 2 + 1 + 5 + 6 + 2 + 3 = 20$
- Calculate the mean
Divide the sum of the products (from step 3) by the sum of the frequencies (from step 4).
Mean = $\frac{162}{20} = 8.1$
The mean number of plants per house is $8.1$.
More Information
The arithmetic mean represents the average number of plants per house in the surveyed locality, based on the provided frequency distribution. The frequency table is discrete, not continuous.
Tips
A common mistake is to directly average the interval endpoints without considering the frequency of each interval. Another mistake is making errors during the arithmetic calculations. Some may also incorrectly interpret the class intervals, leading to wrong midpoints. One can avoid these mistakes by carefully following the steps and double-checking the calculations.
AI-generated content may contain errors. Please verify critical information