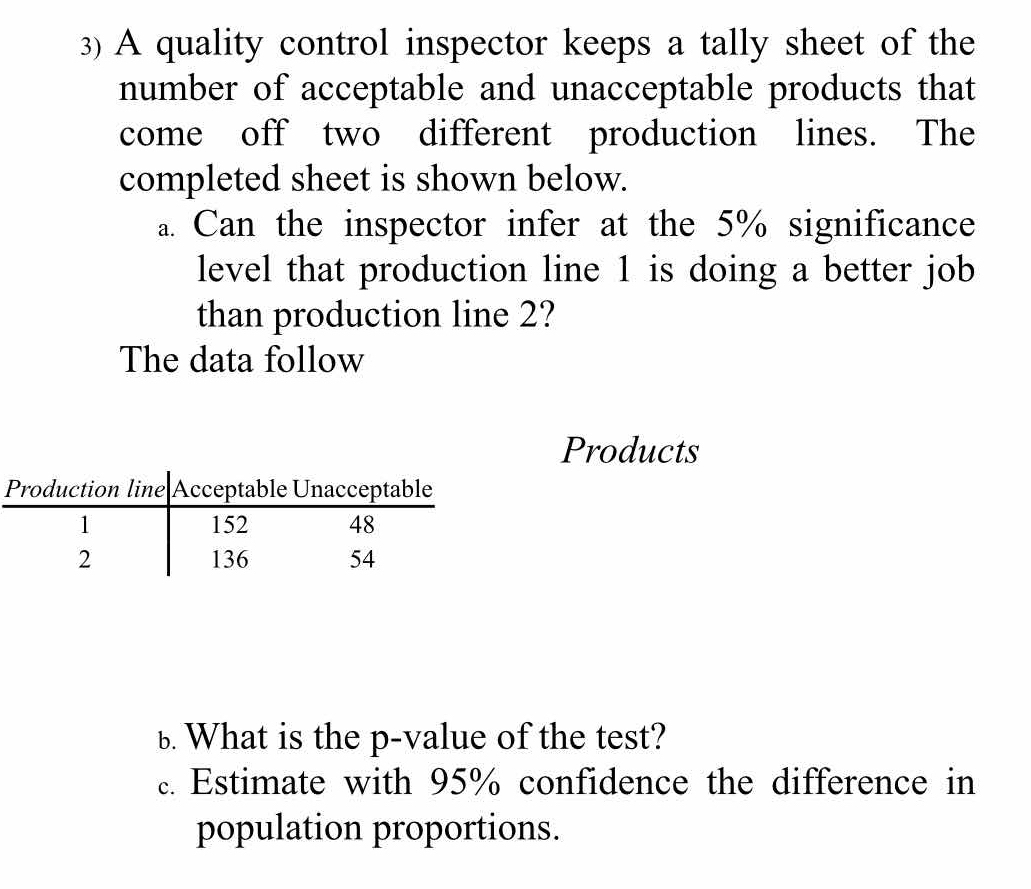
A quality control inspector keeps a tally sheet of the number of acceptable and unacceptable products that come off two different production lines. The completed sheet is shown bel... A quality control inspector keeps a tally sheet of the number of acceptable and unacceptable products that come off two different production lines. The completed sheet is shown below. a. Can the inspector infer at the 5% significance level that production line 1 is doing a better job than production line 2? b. What is the p-value of the test? c. Estimate with 95% confidence the difference in population proportions.
Understand the Problem
This question pertains to hypothesis testing and confidence interval estimation in the context of quality control. Specifically, it involves analyzing data from two production lines to determine if there's a statistically significant difference in their performance based on the number of acceptable and unacceptable products. The inspector wants to know if they can they reject the null hypothesis that the two production lines perform the same. First we must calculate the p-value, and then calculate the confidence interval.
Answer
a. No. b. $p \approx 0.160$ c. $(-0.043, 0.1314)$
Answer for screen readers
a. No, the inspector cannot infer at the 5% significance level that production line 1 is doing a better job than production line 2. b. The p-value of the test is approximately 0.160. c. The 95% confidence interval for the difference in population proportions is approximately (-0.043, 0.1314).
Steps to Solve
- Calculate the sample proportions for each production line
First we need to calculate the proportion of acceptable products for each line. For production line 1: $p_1 = \frac{152}{152 + 48} = \frac{152}{200} = 0.76$ For production line 2: $p_2 = \frac{136}{136 + 54} = \frac{136}{190} \approx 0.7158$
- State the null and alternative hypotheses
The null hypothesis ($H_0$) is that there is no difference in the proportion of acceptable products between the two lines: $p_1 = p_2$. The alternative hypothesis ($H_1$) is that production line 1 has a higher proportion of acceptable products than production line 2: $p_1 > p_2$. This is a one-tailed test.
- Calculate the pooled sample proportion
To perform the z-test for the difference in proportions, we first calculate the pooled sample proportion:
$p = \frac{152 + 136}{200 + 190} = \frac{288}{390} \approx 0.7385$
- Calculate the standard error of the difference in proportions
The standard error (SE) is calculated as: $SE = \sqrt{p(1-p)(\frac{1}{n_1} + \frac{1}{n_2})} = \sqrt{0.7385(1-0.7385)(\frac{1}{200} + \frac{1}{190})} \approx \sqrt{0.7385 \cdot 0.2615 \cdot (0.005 + 0.005263)} \approx \sqrt{0.1931 \cdot 0.010263} \approx \sqrt{0.001982} \approx 0.0445$
- Calculate the test statistic (z-score)
The z-score is calculated as $z = \frac{p_1 - p_2}{SE} = \frac{0.76 - 0.7158}{0.0445} = \frac{0.0442}{0.0445} \approx 0.9933$
- Determine the p-value
Since this is a one-tailed test (we are checking if line 1 is better than line 2), we find the p-value by calculating the probability that $Z > 0.9933$. Using a standard normal table or calculator, we find that $P(Z > 0.9933) \approx 0.160$.
- Make a decision
The significance level is 5%, or 0.05. Since the p-value (0.160) is greater than the significance level (0.05), we fail to reject the null hypothesis.
- Calculate the 95% confidence interval
The 95% confidence interval for the difference in population proportions is calculated as: $(p_1 - p_2) \pm z_{\alpha/2} \sqrt{\frac{p_1(1-p_1)}{n_1} + \frac{p_2(1-p_2)}{n_2}}$ where $z_{\alpha/2}$ is the z-score for a 95% confidence level, which is 1.96.
- Plug in the values
$(0.76 - 0.7158) \pm 1.96 \sqrt{\frac{0.76(1-0.76)}{200} + \frac{0.7158(1-0.7158)}{190}} \approx 0.0442 \pm 1.96 \sqrt{\frac{0.76(0.24)}{200} + \frac{0.7158(0.2842)}{190}} \approx 0.0442 \pm 1.96 \sqrt{\frac{0.1824}{200} + \frac{0.2034}{190}} \approx 0.0442 \pm 1.96 \sqrt{0.000912 + 0.001071} \approx 0.0442 \pm 1.96 \sqrt{0.001983} \approx 0.0442 \pm 1.96 \cdot 0.0445 \approx 0.0442 \pm 0.0872$
- Calculate the confidence interval limits
Lower limit: $0.0442 - 0.0872 = -0.043$ Upper limit: $0.0442 + 0.0872 = 0.1314$ The 95% confidence interval is (-0.043, 0.1314).
a. No, the inspector cannot infer at the 5% significance level that production line 1 is doing a better job than production line 2. b. The p-value of the test is approximately 0.160. c. The 95% confidence interval for the difference in population proportions is approximately (-0.043, 0.1314).
More Information
The p-value is the probability of observing a test statistic as extreme as, or more extreme than, the statistic obtained from a sample, under the assumption that the null hypothesis is true. A confidence interval provides a range of plausible values for the true difference in population proportions.
Tips
A common mistake is to use a two-tailed test when a one-tailed test is appropriate, or vice versa. In this case, the question specifically asks if production line 1 is better than production line 2, indicating a one-tailed test. Another error is using the incorrect formula for standard error or the z-statistic.
AI-generated content may contain errors. Please verify critical information