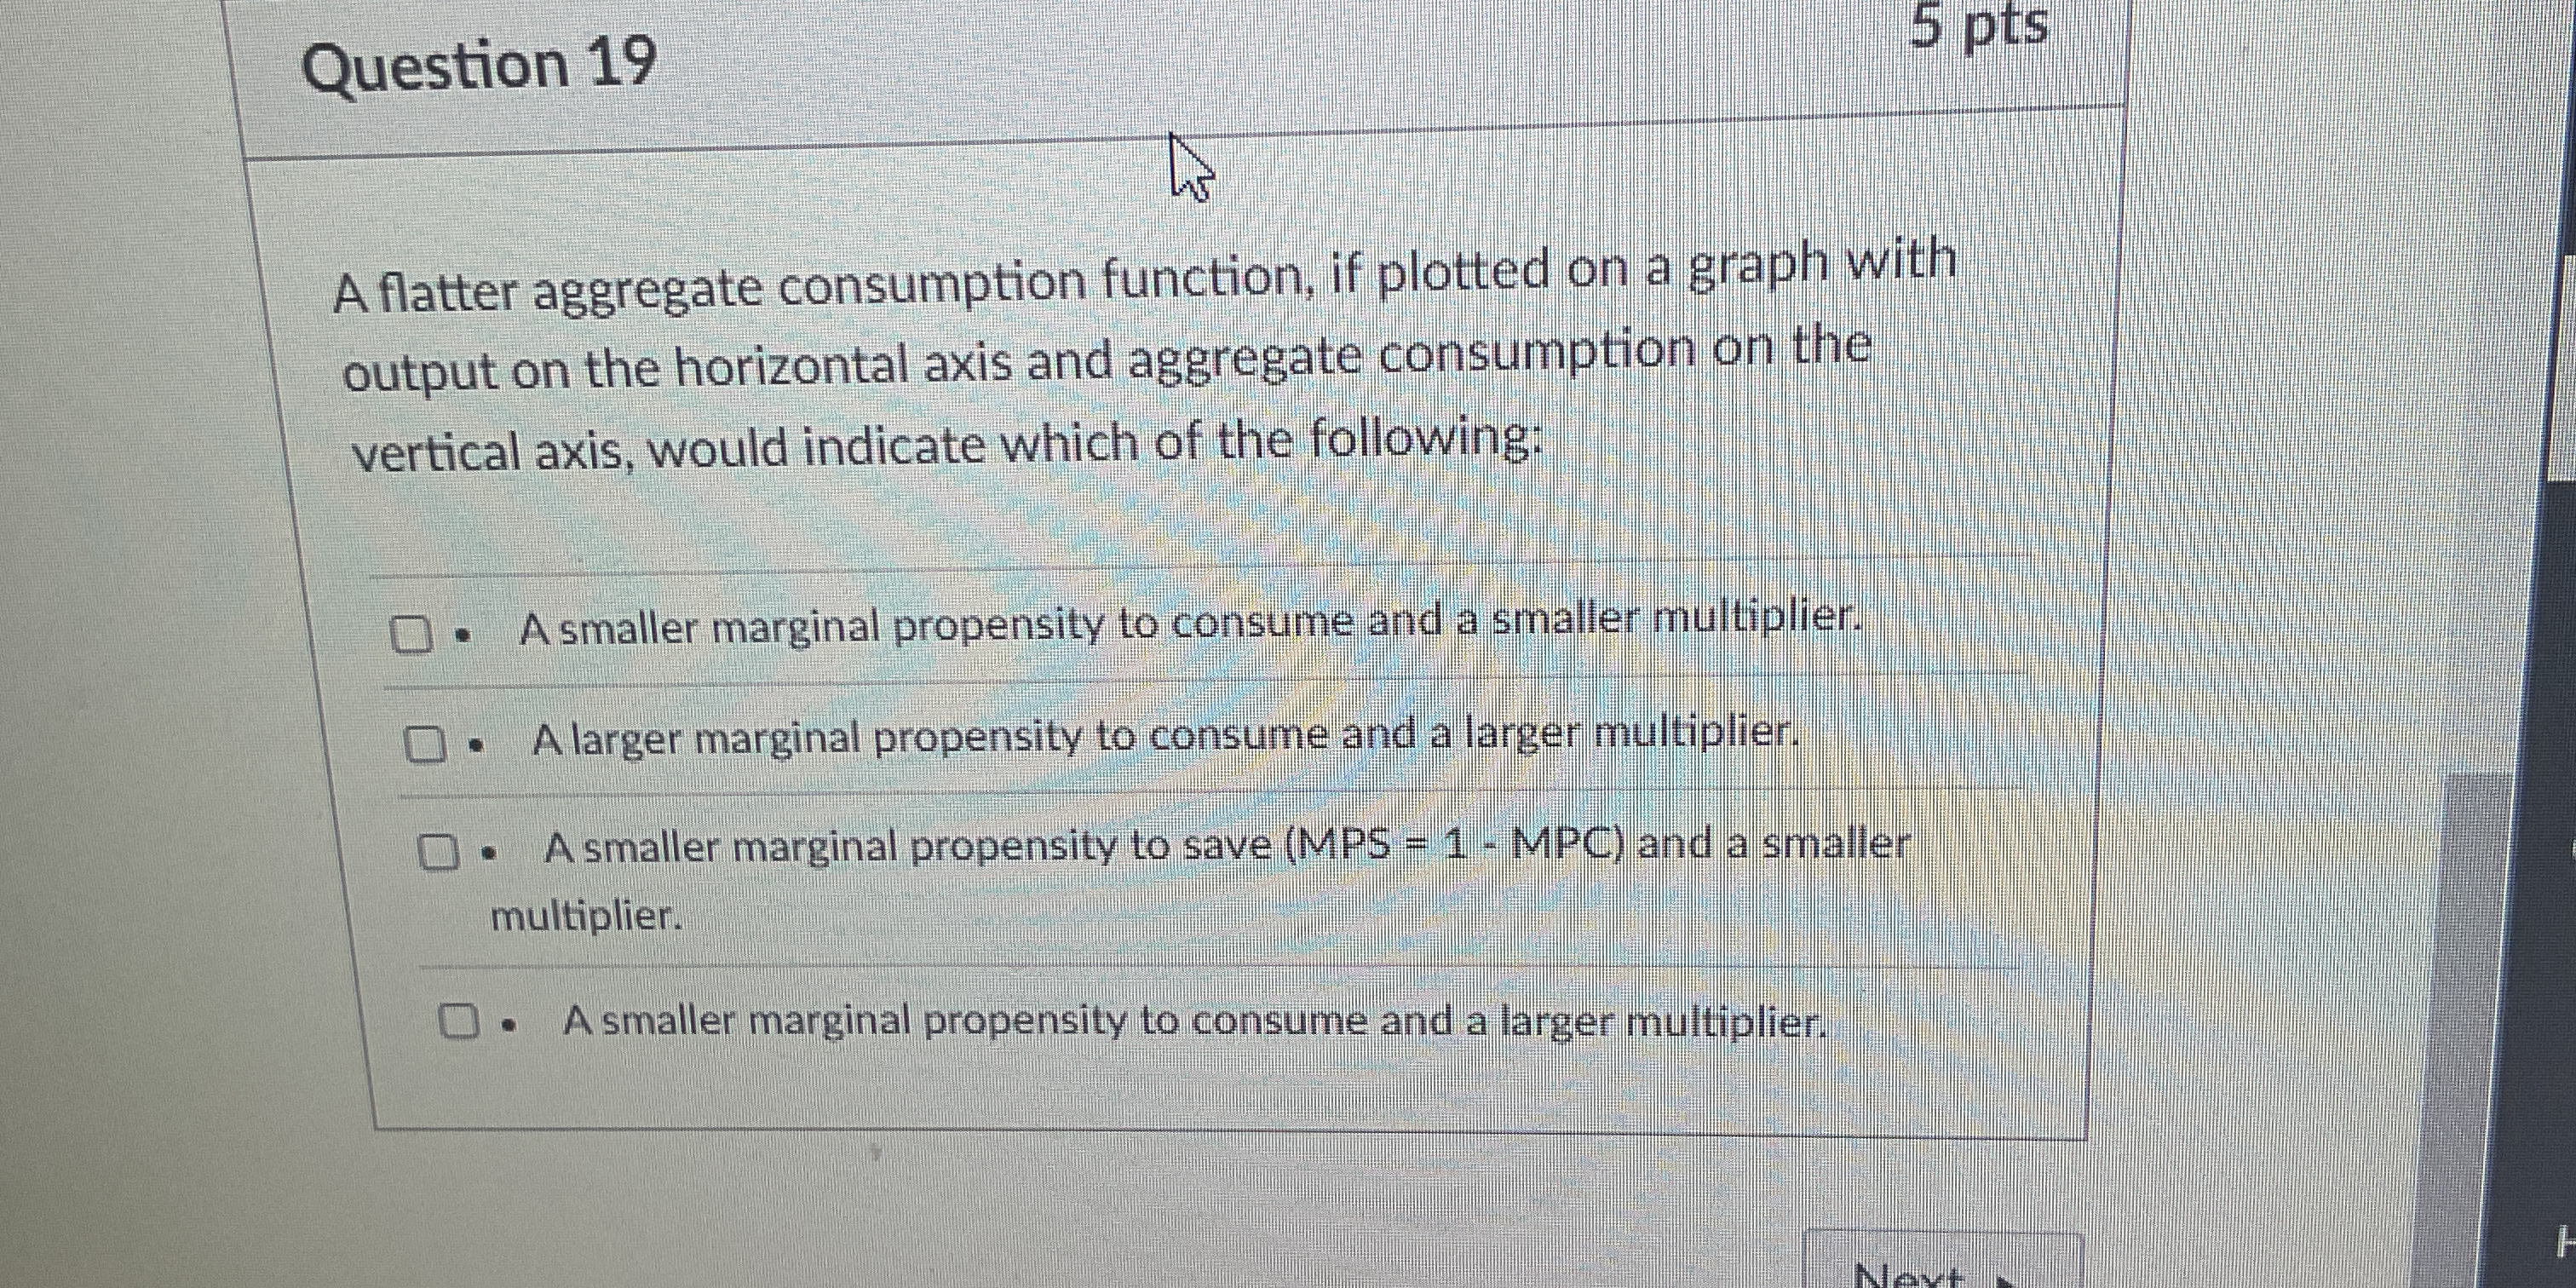
A flatter aggregate consumption function, if plotted on a graph with output on the horizontal axis and aggregate consumption on the vertical axis, would indicate which of the follo... A flatter aggregate consumption function, if plotted on a graph with output on the horizontal axis and aggregate consumption on the vertical axis, would indicate which of the following?
Understand the Problem
The question describes an aggregate consumption function plotted on a graph with output on the x-axis and aggregate consumption on the y-axis. It asks what a flatter slope of this function indicates in terms of marginal propensity to consume (MPC), marginal propensity to save (MPS), and the multiplier effect.
Answer
A smaller marginal propensity to consume and a smaller multiplier.
A flatter aggregate consumption function indicates a smaller marginal propensity to consume and, consequently, a smaller multiplier effect.
Answer for screen readers
A flatter aggregate consumption function indicates a smaller marginal propensity to consume and, consequently, a smaller multiplier effect.
More Information
The consumption function illustrates the relationship between consumer spending and disposable income. Its slope represents the marginal propensity to consume (MPC). A flatter curve signifies that changes in income have a smaller impact on consumption, indicating people are saving more instead.
Tips
A common mistake is to confuse the relationship between the steepness of the consumption function and the size of the multiplier. Remember, a flatter function means a smaller MPC and thus a smaller multiplier.
Sources
AI-generated content may contain errors. Please verify critical information