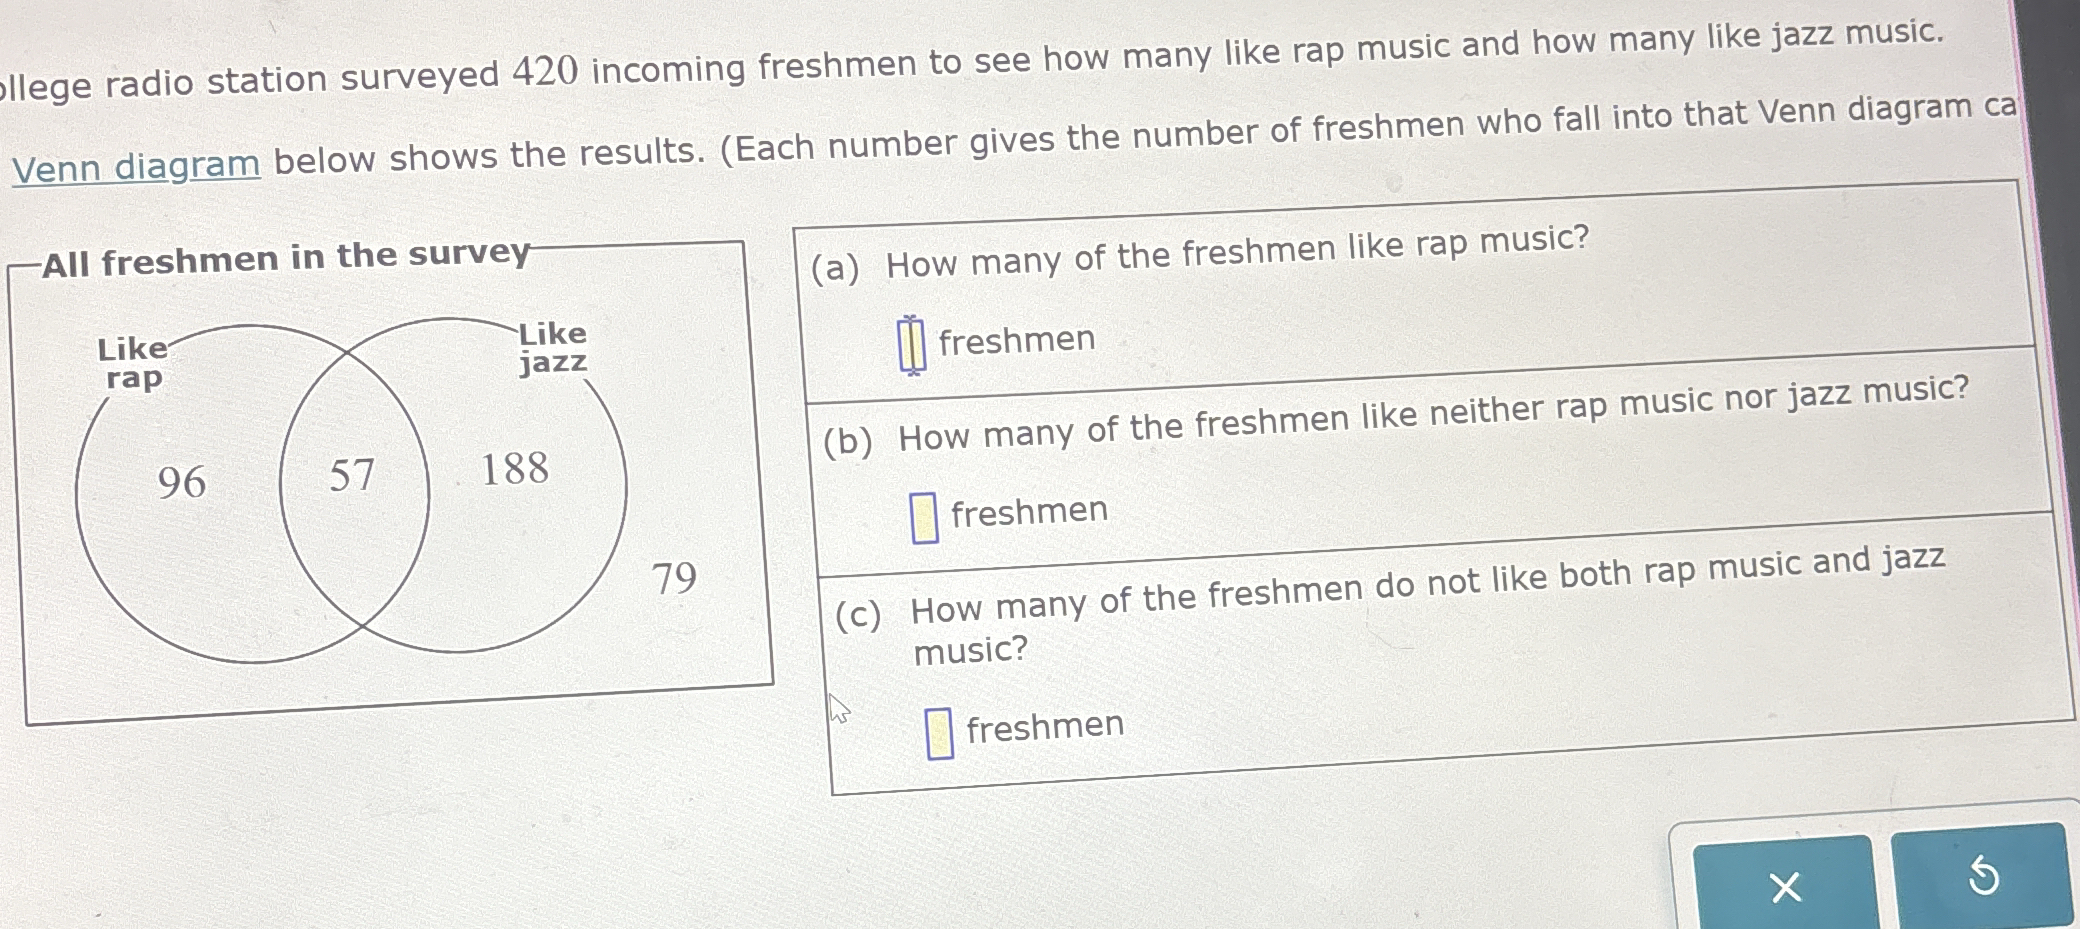
A college radio station surveyed 420 incoming freshmen to see how many like rap music and how many like jazz music. The Venn diagram shows the results. (Each number gives the numbe... A college radio station surveyed 420 incoming freshmen to see how many like rap music and how many like jazz music. The Venn diagram shows the results. (Each number gives the number of freshmen who fall into that Venn diagram category.) (a) How many of the freshmen like rap music? (b) How many of the freshmen like neither rap music nor jazz music? (c) How many of the freshmen do not like both rap music and jazz music?
Understand the Problem
The question presents a Venn diagram showing the number of freshmen who like rap music, jazz music, both, or neither. It asks you to use this information to determine: (a) how many freshmen like rap music, (b) how many like neither rap nor jazz, and (c) how many do not like both rap and jazz music.
Answer
(a) 153 freshmen (b) 79 freshmen (c) 363 freshmen
Answer for screen readers
(a) 153 freshmen (b) 79 freshmen (c) 363 freshmen
Steps to Solve
- Find the number of freshmen who like rap music
The number of freshmen who like rap is the sum of those who like only rap and those who like both rap and jazz. From the Venn diagram, these numbers are 96 and 57, respectively. $96 + 57 = 153$
- Find the number of freshmen who like neither rap nor jazz music
From the Venn diagram, the number of freshmen who like neither rap nor jazz is 79.
- Find the number of freshmen who do not like both rap and jazz music
To find the number of freshmen who do not like both rap and jazz, we subtract the number of freshmen who do like both from the total number of freshmen surveyed. Those that do like both are in the intersection of the two circles, which is 57. Thus we subtract 57 from the total surveyed: $420 - 57 = 363$
(a) 153 freshmen (b) 79 freshmen (c) 363 freshmen
More Information
Venn diagrams are a useful visual tool to represent sets and their intersections. They help to easily visualize and solve problems related to set theory and counting.
Tips
A common mistake when interpreting Venn diagrams is to only consider those who exclusively like rap music, instead of including those who also like jazz. Similarly, when finding those who do not like both rap and jazz, it's important to subtract the intersection from the total population and not from any subset.
AI-generated content may contain errors. Please verify critical information