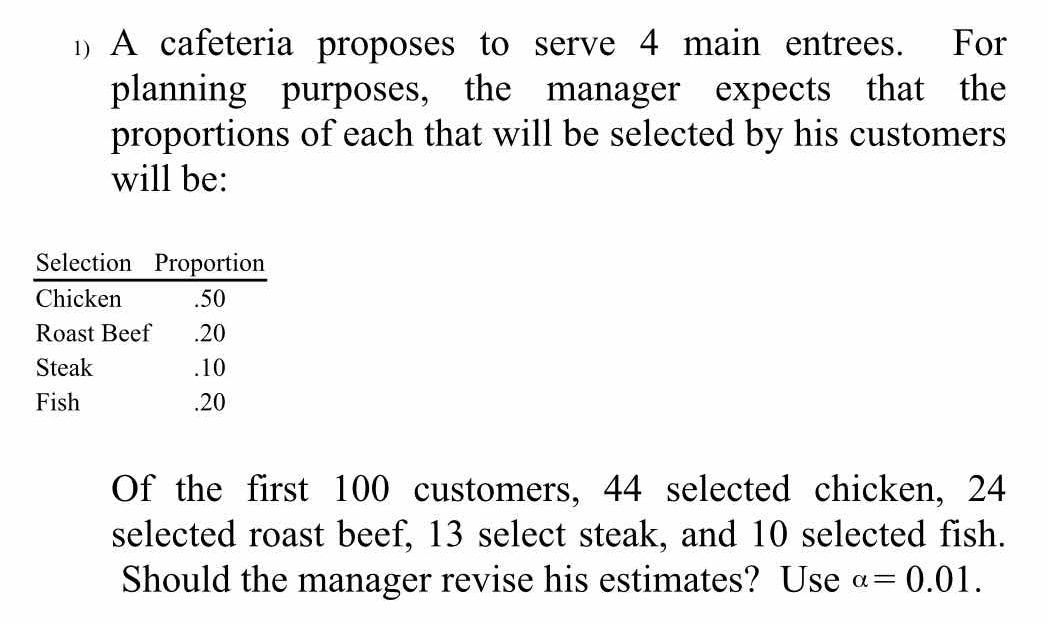
A cafeteria proposes to serve 4 main entrees, with the following expected proportions: Chicken (0.50), Roast Beef (0.20), Steak (0.10), and Fish (0.20). Of the first 100 customers,... A cafeteria proposes to serve 4 main entrees, with the following expected proportions: Chicken (0.50), Roast Beef (0.20), Steak (0.10), and Fish (0.20). Of the first 100 customers, the actual selections were: Chicken (44), Roast Beef (24), Steak (13), and Fish (10). At a significance level of alpha = 0.01, should the manager revise his estimates?
Understand the Problem
The problem describes a scenario where a cafeteria manager wants to determine if their initial estimates of customer entree selection proportions are accurate, based on the actual selections made by the first 100 customers. We need to use a hypothesis test (likely a chi-square test) and compare the observed frequencies of entree selections to the expected frequencies based on the manager's initial proportions. The significance level alpha is 0.01, which will determine the threshold for rejecting the null hypothesis (that the manager's estimates are accurate.)
Answer
No, the manager should not revise his estimates, as the calculated test statistic $\chi^2 = 7.42$ is less than the critical value of 11.345 at $\alpha = 0.01$ and $df = 3$.
Answer for screen readers
The manager should not revise his estimates.
Steps to Solve
- State the null and alternative hypotheses
The null hypothesis ($H_0$) is that the manager's estimated proportions are correct. The alternative hypothesis ($H_1$) is that the manager's estimated proportions are incorrect.
$H_0$: The manager's proportions are correct. $H_1$: The manager's proportions are incorrect.
- Calculate the expected frequencies for each entree
Multiply the proportion of each entree by the total number of customers (100).
Chicken: $0.50 \times 100 = 50$ Roast Beef: $0.20 \times 100 = 20$ Steak: $0.10 \times 100 = 10$ Fish: $0.20 \times 100 = 20$
- Calculate the chi-square test statistic ($\chi^2$)
The chi-square test statistic is calculated as the sum of the squared differences between the observed and expected frequencies, divided by the expected frequencies.
$\chi^2 = \sum \frac{(O_i - E_i)^2}{E_i}$
Where $O_i$ is the observed frequency and $E_i$ is the expected frequency for each entree.
$\chi^2 = \frac{(44-50)^2}{50} + \frac{(24-20)^2}{20} + \frac{(13-10)^2}{10} + \frac{(10-20)^2}{20}$ $\chi^2 = \frac{(-6)^2}{50} + \frac{(4)^2}{20} + \frac{(3)^2}{10} + \frac{(-10)^2}{20}$ $\chi^2 = \frac{36}{50} + \frac{16}{20} + \frac{9}{10} + \frac{100}{20}$ $\chi^2 = 0.72 + 0.8 + 0.9 + 5$ $\chi^2 = 7.42$
- Determine the degrees of freedom (df)
The degrees of freedom are calculated as the number of categories (entrees) minus 1. $df = 4 - 1 = 3$
- Find the critical value from the chi-square distribution table
Using the significance level $\alpha = 0.01$ and $df = 3$, the critical value from the chi-square distribution table is 11.345.
- Compare the test statistic to the critical value and make a decision
If the calculated $\chi^2$ value is greater than the critical value, we reject the null hypothesis. Otherwise, we fail to reject the null hypothesis.
In this case, $7.42 < 11.345$. Therefore, we fail to reject the null hypothesis.
- Conclusion
Since we fail to reject the null hypothesis, we do not have enough evidence to conclude that the manager's estimates are incorrect. The manager should NOT revise his estimates.
The manager should not revise his estimates.
More Information
The Chi-Square test is commonly used to determine association between categorical variables.
Tips
A common mistake is to incorrectly calculate the degrees of freedom, which would lead to an incorrect critical value and a wrong conclusion. Also, failing to calculate expected values properly is another common mistake.
AI-generated content may contain errors. Please verify critical information