4.3.1 Name ONE other type of graph that could be used to display the data above. 4.3.2 Calculate the missing value D in Katleho's monthly budget. 4.3.3 Determine (as a decimal) the... 4.3.1 Name ONE other type of graph that could be used to display the data above. 4.3.2 Calculate the missing value D in Katleho's monthly budget. 4.3.3 Determine (as a decimal) the probability of randomly choosing an item in the parents' budget which is NOT savings.
Understand the Problem
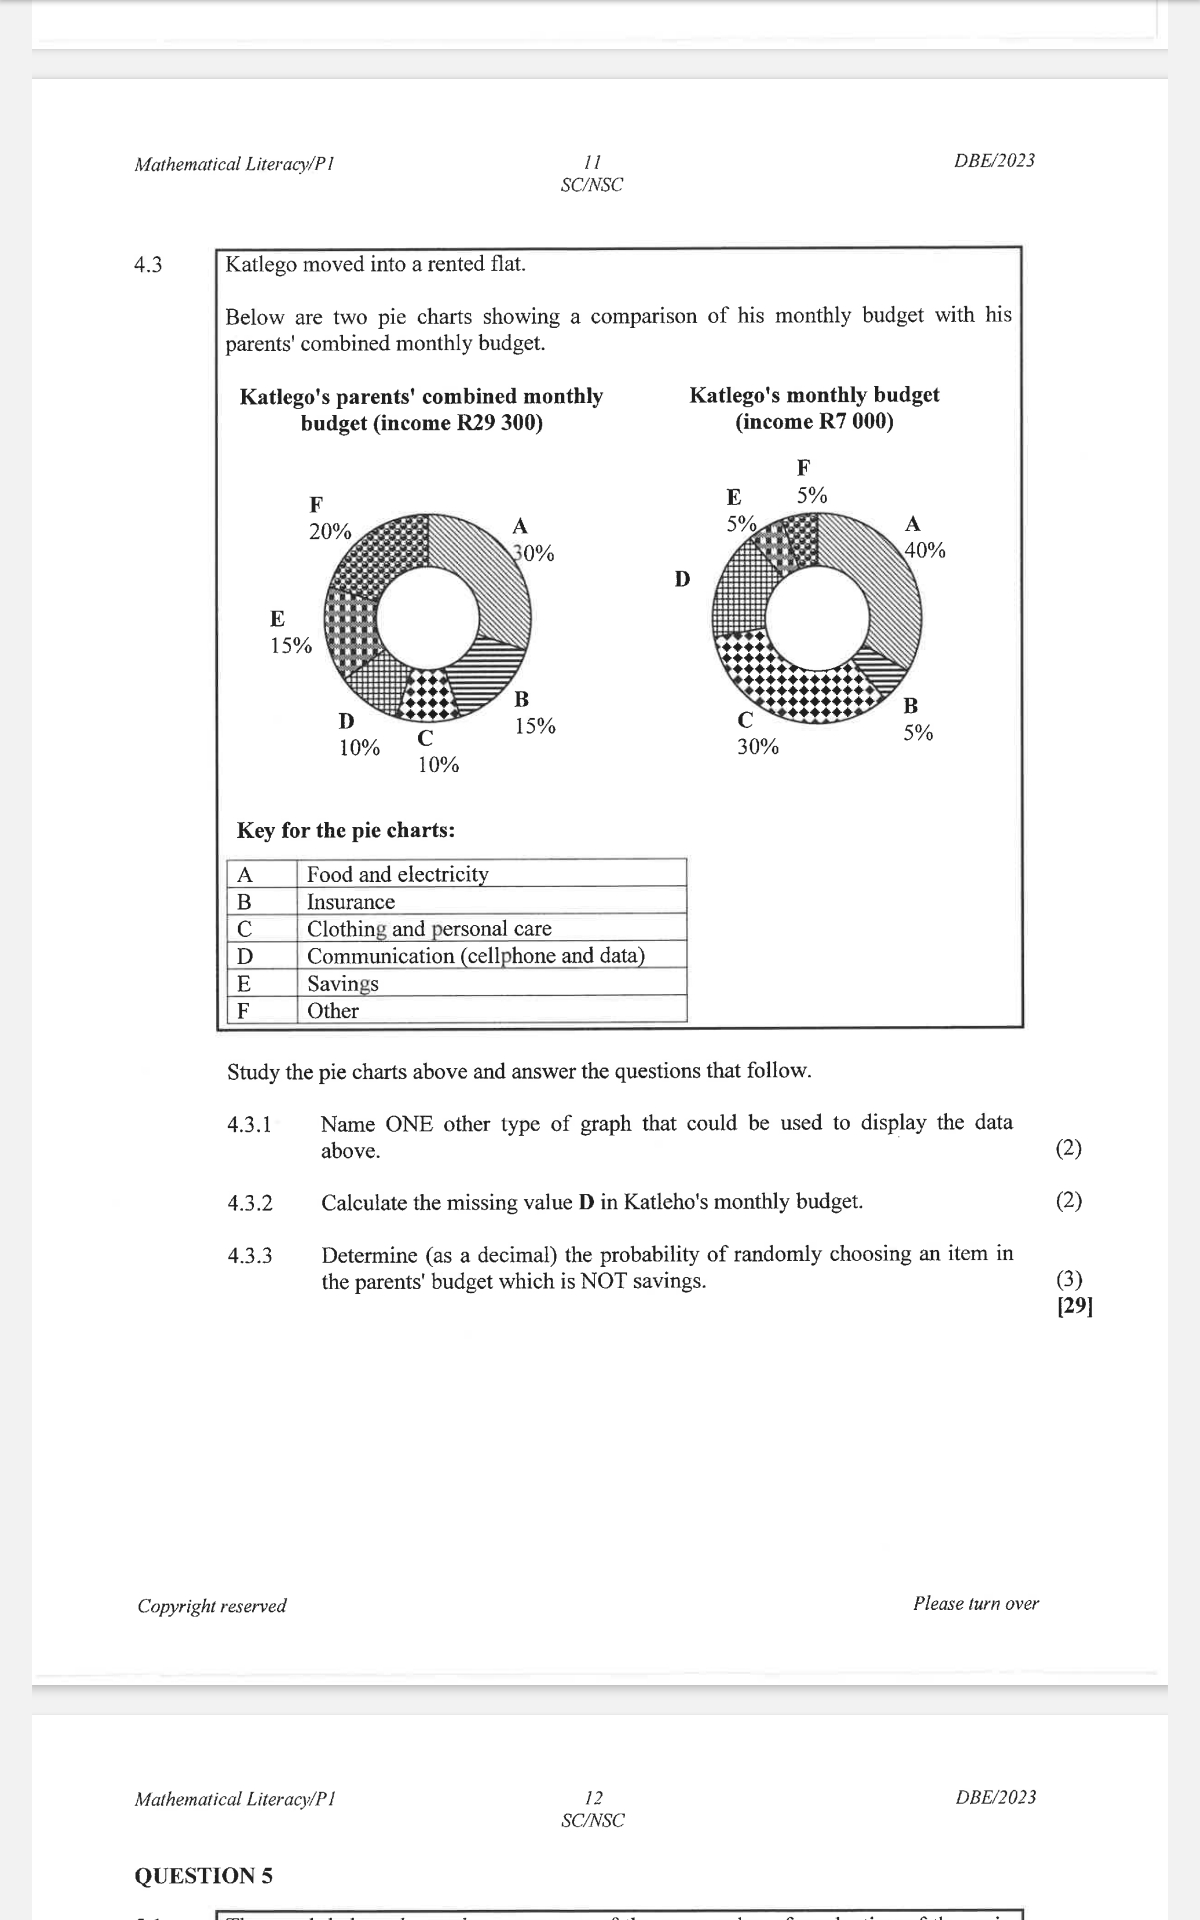
The question provides two pie charts comparing Katlego's monthly budget with his parents' combined monthly budget. You need to answer three questions: (1) Suggest an alternative graph type to display the data. (2) Calculate the missing percentage value for 'D' in Katlego's monthly budget. (3) Determine the probability (as a decimal) of randomly selecting a non-savings item from the parents' budget.
Answer
4.3.1. Bar graph 4.3.2. $15\%$ 4.3.3. 0.85
Answer for screen readers
4.3.1. Bar graph (or Column graph) 4.3.2. $D = 15%$ 4.3.3. 0.85
Steps to Solve
- Suggesting an alternative graph type
A bar graph or column graph could be used to display the data. These graphs easily allow for comparison of the different budget items (A, B, C, D, E, F) between Katlego and his parents.
- Calculate the missing percentage D in Katlego's budget
The total percentage of a pie chart must equal 100%. To find the missing percentage for 'D' in Katlego's budget, we'll add up all the known percentages and subtract from 100%. $D = 100% - (A + B + C + E + F)$ $D = 100% - (40% + 5% + 30% + 5% + 5%)$ $D = 100% - 85%$ $D = 15%$
- Determine the probability of selecting a non-savings item from the parents' budget
First, determine the percentage allocated to savings (E) in the parents' budget, which is given as 15%. The question asks or the probability of not selecting savings. Thus, find the total percentage of all other items. $P(\text{not savings}) = 100% - P(\text{savings})$ $P(\text{not savings}) = 100% - 15% = 85%$
Convert the percentage to a decimal by dividing by 100. $85% = \frac{85}{100} = 0.85$
4.3.1. Bar graph (or Column graph) 4.3.2. $D = 15%$ 4.3.3. 0.85
More Information
Percentages are used to represent proportions of a whole. Probabilities must range from 0 to 1, and can be found by dividing the number of desired outcomes by the total number of possible outcomes.
Tips
- For 4.3.2, forgetting to subtract the sum of all the known percentages from 100%.
- For 4.3.3, forgetting to convert the percentage to a decimal by dividing by 100.
- For 4.3.3, calculating the probability of selecting the savings item instead of a non-savings item.
AI-generated content may contain errors. Please verify critical information