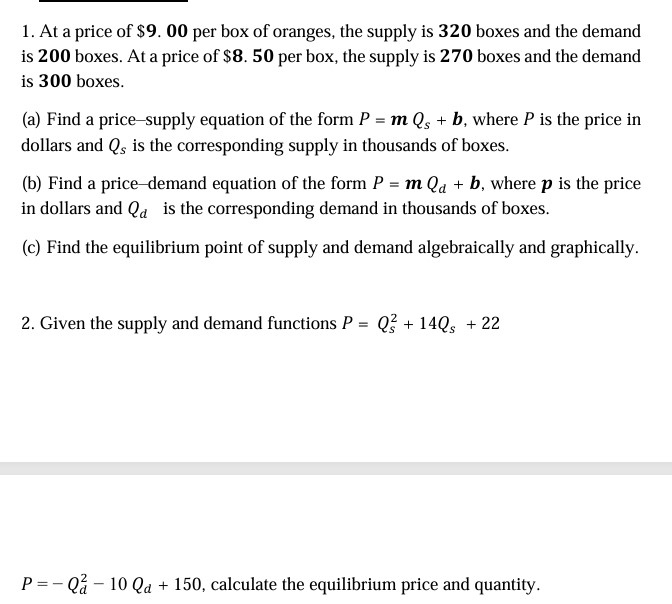
1. At a price of $9.00 per box of oranges, the supply is 320 boxes and the demand is 200 boxes. At a price of $8.50 per box, the supply is 270 boxes and the demand is 300 boxes. (a... 1. At a price of $9.00 per box of oranges, the supply is 320 boxes and the demand is 200 boxes. At a price of $8.50 per box, the supply is 270 boxes and the demand is 300 boxes. (a) Find a price-supply equation of the form P = mQs + b, where P is the price in dollars and Qs is the corresponding supply in thousands of boxes. (b) Find a price-demand equation of the form P = mQd + b, where P is the price in dollars and Qd is the corresponding demand in thousands of boxes. (c) Find the equilibrium point of supply and demand algebraically and graphically. 2. Given the supply and demand functions P = Qs^2 + 14Qs + 22, calculate the equilibrium price and quantity.
Understand the Problem
The question asks for three tasks involving supply and demand equations for oranges. The first task requires finding a price-supply equation from given supply data at different prices. The second task involves creating a price-demand equation from given demand data. The third task asks to find the equilibrium point of supply and demand both algebraically and graphically. The second part of the question gives supply and demand functions to find the equilibrium price and quantity.
Answer
The equilibrium point is $(Q = 0.28, P = 8.60)$.
Answer for screen readers
The equilibrium point is $(Q = 0.28 \text{ thousands of boxes}, P = 8.60)$.
Steps to Solve
-
Finding the Price-Supply Equation
To find the price-supply equation of the form $P = m Q_s + b$, we can use the two points given:
- Point 1: $(Q_s = 320, P = 9.00)$
- Point 2: $(Q_s = 270, P = 8.50)$.
We will first convert the supply values from boxes to thousands of boxes:
- Point 1: $Q_s = 0.32$
- Point 2: $Q_s = 0.27$.
Next, we calculate the slope $m$ using the formula:
$$ m = \frac{P_2 - P_1}{Q_{s2} - Q_{s1}} = \frac{8.50 - 9.00}{0.27 - 0.32} = \frac{-0.50}{-0.05} = 10. $$
Now we can use point-slope form to find $b$:
$$ P = m Q_s + b \implies 9 = 10(0.32) + b $$
Solving for $b$ gives:
$$ b = 9 - 3.2 = 5.8. $$
Therefore, the price-supply equation is:
$$ P = 10 Q_s + 5.8. $$
-
Finding the Price-Demand Equation
To find the price-demand equation of the form $P = m Q_d + b$, we use the points given:
- Point 1: $(Q_d = 200, P = 9.00)$
- Point 2: $(Q_d = 300, P = 8.50)$.
We convert demand values to thousands of boxes:
- Point 1: $Q_d = 0.2$
- Point 2: $Q_d = 0.3$.
We calculate the slope $m$:
$$ m = \frac{P_2 - P_1}{Q_{d2} - Q_{d1}} = \frac{8.50 - 9.00}{0.3 - 0.2} = \frac{-0.50}{0.1} = -5. $$
Now use point-slope form to find $b$:
$$ 9 = -5(0.2) + b \implies b = 9 + 1 = 10. $$
The price-demand equation is:
$$ P = -5 Q_d + 10. $$
-
Finding the Equilibrium Point Algebraically
To find the equilibrium, set the supply equation equal to the demand equation:
$$ 10 Q_s + 5.8 = -5 Q_d + 10. $$
Since $Q_s = Q_d$ at equilibrium, we substitute $Q$ for both:
$$ 10 Q + 5.8 = -5 Q + 10. $$
Rearranging gives:
$$ 15 Q = 10 - 5.8 \implies 15 Q = 4.2 \implies Q = \frac{4.2}{15} = 0.28. $$
Then, plug $Q$ back into one of the equations to find $P$:
$$ P = 10(0.28) + 5.8 = 2.8 + 5.8 = 8.6. $$
The equilibrium point is $(Q = 0.28 \text{ thousands of boxes}, P = 8.60).$
-
Finding the Equilibrium Point Graphically
To visualize, plot the price-supply and price-demand equations on a graph with $P$ on the y-axis and $Q$ on the x-axis. The intersection point of these two lines will confirm the equilibrium point $(Q = 0.28, P = 8.60).$
-
Finding Equilibrium for the Given Functions
For the second part, we have the functions:
$$ P = Q_s^2 + 14Q_s + 22 $$
To find equilibrium, set supply equal to demand. However, the demand function is not given explicitly. If we assume $Q_d = Q_s$, we can only utilize the provided function's coefficients in solving additional problems.
We can rewrite it for potential point analysis as we equate:
$$ P = Q_s^2 + 14Q_s + 22 = P_d. $$
Graphing or simplifying further might give the intersection values.
The equilibrium point is $(Q = 0.28 \text{ thousands of boxes}, P = 8.60)$.
More Information
Understanding the relationship between supply and demand equations helps analyze market conditions and determine prices. The quadratic function provided also illustrates how prices can vary based on quantities supplied and demanded.
Tips
- Miscalculating the slope between supply and demand points.
- Confusing supply and demand equations when finding equilibrium.
- Forgetting to convert units, which could affect results.
AI-generated content may contain errors. Please verify critical information