Podcast
Questions and Answers
In the context of cartography and spatial data representation, which statement most accurately delineates the fundamental difference between a map and a satellite image?
In the context of cartography and spatial data representation, which statement most accurately delineates the fundamental difference between a map and a satellite image?
- Maps are inherently limited to depicting human features, while satellite images provide a comprehensive view of both physical and human constructs without abstraction.
- Maps involve a degree of abstraction and symbolic representation of the Earth's surface, while satellite images are primarily direct, uninterpreted representations captured via remote sensing. (correct)
- Maps primarily serve aesthetic purposes in geographical representation, whereas satellite images are exclusively utilized for scientific analysis, bypassing cartographic principles.
- Maps represent reality as directly captured sensor data, whereas satellite images are graphical abstractions subject to cartographic generalization.
Considering the dual nature of maps as tools for both representation and analysis, which epistemological challenge is most pertinent to the use of world maps in contemporary geographical research?
Considering the dual nature of maps as tools for both representation and analysis, which epistemological challenge is most pertinent to the use of world maps in contemporary geographical research?
- The obsolescence of cartographic techniques, which render traditional world maps unsuitable for integration with modern geospatial technologies.
- The inherent scale limitations, which restrict the ability to conduct micro-level analysis without supplementary data sources.
- The propagation of geometric distortions inherent in map projections, which can substantially bias spatial analyses and statistical modeling.
- The subjective selection of features and attributes for inclusion, which can inadvertently reinforce pre-existing biases and limit the scope of inquiry. (correct)
Which theoretical framework most rigorously addresses the socio-political implications embedded in the creation and interpretation of maps, particularly concerning their role in shaping perceptions of global space and power dynamics?
Which theoretical framework most rigorously addresses the socio-political implications embedded in the creation and interpretation of maps, particularly concerning their role in shaping perceptions of global space and power dynamics?
- Quantitative Revolution
- Environmental Determinism
- Possibilism
- Critical Cartography (correct)
In the context of spatial cognition and environmental psychology, how might the exclusive reliance on digital map interfaces, as opposed to traditional paper maps, impact an individual's cognitive mapping skills and understanding of spatial relationships?
In the context of spatial cognition and environmental psychology, how might the exclusive reliance on digital map interfaces, as opposed to traditional paper maps, impact an individual's cognitive mapping skills and understanding of spatial relationships?
A researcher aims to analyze urban sprawl using a combination of historical maps and contemporary satellite imagery. Which methodological challenge is MOST critical to address to ensure data integrity and analytical validity?
A researcher aims to analyze urban sprawl using a combination of historical maps and contemporary satellite imagery. Which methodological challenge is MOST critical to address to ensure data integrity and analytical validity?
Cartographic conventions dictate the symbolic representation of geographical features. Considering the principles of semiotics and map abstraction, which of the following statements BEST encapsulates the rationale behind using green for vegetation in area symbols on topographical maps, accounting for potential exceptions and cultural interpretations?
Cartographic conventions dictate the symbolic representation of geographical features. Considering the principles of semiotics and map abstraction, which of the following statements BEST encapsulates the rationale behind using green for vegetation in area symbols on topographical maps, accounting for potential exceptions and cultural interpretations?
Given a topographical map lacking a north line or compass rose, and presuming north is towards the top of the map according to convention, evaluate the potential impact of magnetic declination and map projection on determining accurate compass directions, while also considering the distortions introduced by representing a three-dimensional surface on a two-dimensional plane.
Given a topographical map lacking a north line or compass rose, and presuming north is towards the top of the map according to convention, evaluate the potential impact of magnetic declination and map projection on determining accurate compass directions, while also considering the distortions introduced by representing a three-dimensional surface on a two-dimensional plane.
In the context of contour lines on a topographic map, synthesize an understanding of how their spacing relates to terrain morphology and quantitatively assess the limitations of using only contour lines to infer subsurface geological structures, considering the potential for spatial aliasing and the inherent ambiguity in representing three-dimensional features in two dimensions.
In the context of contour lines on a topographic map, synthesize an understanding of how their spacing relates to terrain morphology and quantitatively assess the limitations of using only contour lines to infer subsurface geological structures, considering the potential for spatial aliasing and the inherent ambiguity in representing three-dimensional features in two dimensions.
Given the principles of grid reference systems on maps, and accounting for potential errors introduced during map digitization and georeferencing, how would you apply error propagation techniques to quantify the uncertainty in a derived spatial analysis that relies on precise location data extracted from four-figure grid references?
Given the principles of grid reference systems on maps, and accounting for potential errors introduced during map digitization and georeferencing, how would you apply error propagation techniques to quantify the uncertainty in a derived spatial analysis that relies on precise location data extracted from four-figure grid references?
Analyze the implications of employing different map projections (e.g., Mercator, azimuthal equidistant, equal-area) on the accurate representation of compass directions across varying spatial scales, and elaborate on how these distortions might affect navigational decisions in both traditional cartography and modern GIS-based applications.
Analyze the implications of employing different map projections (e.g., Mercator, azimuthal equidistant, equal-area) on the accurate representation of compass directions across varying spatial scales, and elaborate on how these distortions might affect navigational decisions in both traditional cartography and modern GIS-based applications.
Considering the geodetic implications of defining the Equator and Prime Meridian, which of the following statements most accurately reflects the inherent challenge in establishing these baselines with absolute certainty?
Considering the geodetic implications of defining the Equator and Prime Meridian, which of the following statements most accurately reflects the inherent challenge in establishing these baselines with absolute certainty?
Given the complexities of representing a three-dimensional Earth on a two-dimensional map, which projection inherently minimizes distortion in both area and shape, while maintaining accurate relative distances, for mapping mid-latitude regions?
Given the complexities of representing a three-dimensional Earth on a two-dimensional map, which projection inherently minimizes distortion in both area and shape, while maintaining accurate relative distances, for mapping mid-latitude regions?
Considering the geodetic datum and its impact on coordinate accuracy, how would you reconcile discrepancies in positional data derived from different datums, specifically when integrating historical maps (pre-satellite era) with modern GPS data for a precise GIS analysis?
Considering the geodetic datum and its impact on coordinate accuracy, how would you reconcile discrepancies in positional data derived from different datums, specifically when integrating historical maps (pre-satellite era) with modern GPS data for a precise GIS analysis?
When analyzing topographic maps, how does the spatial distribution and geometry of contour lines directly reveal the hydrogeological characteristics relevant to groundwater flow and aquifer vulnerability assessment in a karst landscape?
When analyzing topographic maps, how does the spatial distribution and geometry of contour lines directly reveal the hydrogeological characteristics relevant to groundwater flow and aquifer vulnerability assessment in a karst landscape?
In the context of cartographic generalization, contrast the application of the Douglas-Peucker algorithm versus the Visvalingam-Whyatt algorithm for simplifying complex linear features on a topographic map, specifically concerning their impact on retaining critical geomorphological information.
In the context of cartographic generalization, contrast the application of the Douglas-Peucker algorithm versus the Visvalingam-Whyatt algorithm for simplifying complex linear features on a topographic map, specifically concerning their impact on retaining critical geomorphological information.
Flashcards
What are maps?
What are maps?
Maps are visual representations of the Earth's surface, showing general or specific details.
Secondary Data
Secondary Data
Information initially gathered or interpreted by someone else.
Satellite Images
Satellite Images
Photographs of the Earth taken from space.
What is a world map?
What is a world map?
Signup and view all the flashcards
Map Features
Map Features
Signup and view all the flashcards
Latitude
Latitude
Signup and view all the flashcards
Equator
Equator
Signup and view all the flashcards
Longitude
Longitude
Signup and view all the flashcards
Prime Meridian
Prime Meridian
Signup and view all the flashcards
Topographic Maps
Topographic Maps
Signup and view all the flashcards
Point Symbol
Point Symbol
Signup and view all the flashcards
Area Symbol
Area Symbol
Signup and view all the flashcards
Height Symbol
Height Symbol
Signup and view all the flashcards
Grid Lines
Grid Lines
Signup and view all the flashcards
Contour Lines
Contour Lines
Signup and view all the flashcards
Study Notes
- Maps are a vital form of secondary data which presents important information about the world
- Maps show general or specific details of the world or an area in the world
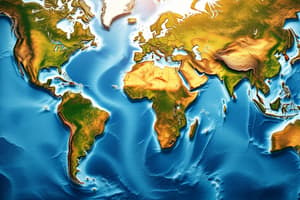
- Maps are a graphical representation of all or part of the Earth's surface
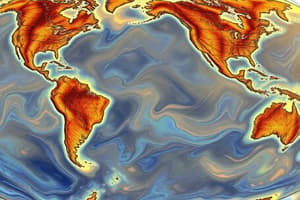
- Satellite images are photographs taken by satellites and show the view of the Earth from space
World Map
- A world map is a collection of maps showing the world, different continents, and countries
- World maps show physical features like coastlines, rivers, and mountains
- World maps show human features like cities, towns, and roads
- World maps provide a comprehensive view of the world
- World maps are useful when conducting research
- There are 7 continents and 5 oceans
Latitude
- Latitude is the angular distance of a place north or south of the Equator
- Latitude 0° is the Equator, an imaginary horizontal line around the globe which separates it into two equal parts: the Northern and Southern Hemispheres
- Imaginary lines run from east to west around the globe, connecting points with the same latitude
- Latitude is measured in degrees
- Latitude values increase north or south of the Equator
Longitude
- Longitude (meridians) is the angular distance of a place east or west of the Prime Meridian
- Longitude 0° is the Prime Meridian (Greenwich Meridian), an imaginary vertical line between the North and South Poles, and passes through the Royal Observatory in Greenwich, England
- Imaginary lines run from north to south of the globe, connecting points with the same longitude
- Longitude is measured in degrees
- Longitude values increase accordingly from the Prime Meridian
Using Latitude and Longitude
- Provide the 'global addresses' or locations of places on earth
- Lines of latitude run in an east-west direction
- Lines of longitude run in a north-south direction
- Latitude and longitude lines cross each other
- A 'global address' is given as two-numbers: the latitude number, followed by the longitude number
- For example, Place A in Canada is at latitude 54°N and longitude 110°W, and Place B in Mexico is at latitude 28°N and longitude 108°W
Topographic Maps
- Topographic maps show the physical and human features of an area through the use of contour lines and symbols
- Topographic maps are useful when studying the details of a place, such as the height of the land, the location of rivers and vegetation, and the types of human activity
Parts of a Topographic Map
- The title of the map will tell you the area shown
- Contour lines join places of the same height and also show height
- The scale shows how the map sizes compare to actual size
- The legend explains the symbols used
- Names of landmarks have been added, for easy reference
- The North arrow indicates the direction of north on the map
- Grid lines are the vertical and horizontal lines drawn on a map
Symbols on a Topographic Map
- Linear symbols represent features such as roads, railways, expressways, power lines, and rivers
- Blue is generally used for water features while red is used for important roads
- Point symbols represent features that occupy a small area, like buildings, schools, places of worship, and mines
- Area symbols represent features that occupy a wide area, such as plantations, forests, lakes, and built-up areas
- Green is generally used for vegetation
- Abbreviations represent different types of buildings or features
- Height symbols show the height or elevation of places
- Contour lines indicate the land height
- Close contour lines mean a steep slope
- Wide contour lines mean a gentle slope
Grid References
- Vertical and horizontal lines are called grid lines
- Grid lines form grid squares
- Eastings increase towards the east
- Northings increase towards the north
Four-Figure Grid Reference
- Four-figure grid references are used to identify the general location of a feature on a map
Compass Directions
- Compass directions give accurate directions to places
- The four compass points (cardinal points) are north (N), south (S), east (E), and west (W)
- Compass points can be further divided into eight compass points
- Some topographical maps do not show a north line or compass rose
- If there is no compass rose then assume that north is towards the top of the map
Measuring Distance
- All maps show things smaller than they are in real life and are drawn to scale for accuracy
- Scale is the ratio of the distance on a map and the actual distance on the ground, and affects the amount of detail shown
- A map with a smaller scale shows fewer details
- A map with a larger scale shows more details
- Scale can be used to find out the actual distance between two points on the ground
Measuring Straight-Line Distances
- A ruler can measure the distance between two features on a map
- The measurement on the ruler can be multiplied with the actual distance to calculate the measurement using a statement scale
Studying That Suits You
Use AI to generate personalized quizzes and flashcards to suit your learning preferences.