Podcast
Questions and Answers
What is the primary purpose of creating a graph?
What is the primary purpose of creating a graph?
- To collect data points
- To show the relationship between two variables (correct)
- To draw a picture
- To measure the amount of rainfall
What are the two variables that might be plotted on a graph?
What are the two variables that might be plotted on a graph?
- Month and inches of rainfall (correct)
- Rainfall and temperature
- Time and distance
- Height and weight
What type of graph is commonly used to show how data changes over time?
What type of graph is commonly used to show how data changes over time?
- Bar graph
- Pie chart
- Line graph (correct)
- Scatter plot
On a line graph, what is typically plotted on the horizontal axis?
On a line graph, what is typically plotted on the horizontal axis?
What is the process of creating a line graph?
What is the process of creating a line graph?
What does a line graph show?
What does a line graph show?
What is the purpose of a double-line graph?
What is the purpose of a double-line graph?
What is the main difference between a line graph and a pie graph?
What is the main difference between a line graph and a pie graph?
What does a pie graph typically represent?
What does a pie graph typically represent?
Why would someone use a pie graph to display their expenses?
Why would someone use a pie graph to display their expenses?
Flashcards are hidden until you start studying
Study Notes
What are Graphs?
- A graph is a visual representation of a set of data points, often showing the relationship between two variables.
- There are various types of graphs, including line and pie graphs.
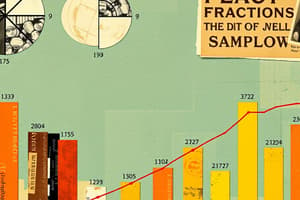
Drawing a Graph from Data
- Data is a collection of information involving two variables, such as rainfall measured in inches and the month it fell.
- To construct a graph, a vertical and horizontal axis are used, and different types of graphs can be created, including line graphs, bar graphs, and scatter plots.
Line Graphs
- A line graph displays data as increasing and decreasing segments connected to form a continuous line.
- Variables are examined, such as the number of babies born at a hospital on each day in May.
- The day of the month is plotted along the horizontal axis, and the number of babies is plotted along the vertical axis.
- Points are plotted and connected using line segments, showing increases and decreases in the data.
- Double-line graphs can be used to compare two sets of data, such as the number of boys and girls born at the hospital.
Pie Graphs
- A pie graph is a circular representation of data, divided into categories and shown as a percentage of the whole circle.
- Categories are usually in different colors and are depicted as "pie slices".
- Pie graphs can be used to show how someone spends their money each month, broken down into categories such as mortgage, utilities, food, and entertainment.
- Each category represents a percentage of the total expenses, and the pie slices are drawn accordingly.
Studying That Suits You
Use AI to generate personalized quizzes and flashcards to suit your learning preferences.