Podcast
Questions and Answers
What do overlapping areas in a Venn diagram represent?
What do overlapping areas in a Venn diagram represent?
- Differences between groups
- Unique attributes of each group
- Both similarities and differences between groups
- Similarities between groups (correct)
Who invented the Venn diagram?
Who invented the Venn diagram?
- George Boole
- William Stanley Jevons
- Charles Darwin
- John Venn (correct)
What is the main purpose of using a Venn diagram?
What is the main purpose of using a Venn diagram?
- To confuse the audience
- To hide information
- To communicate complex ideas visually (correct)
- To make presentations longer
Which field commonly uses Venn diagrams?
Which field commonly uses Venn diagrams?
How are differences between groups represented in a Venn diagram?
How are differences between groups represented in a Venn diagram?
What does each circle in a Venn diagram represent?
What does each circle in a Venn diagram represent?
How can the appearance of Venn diagrams be enhanced?
How can the appearance of Venn diagrams be enhanced?
In what settings are Venn diagrams used to help students compare and contrast different concepts?
In what settings are Venn diagrams used to help students compare and contrast different concepts?
Which field uses Venn diagrams to represent complex relationships such as the three pillars of sustainability?
Which field uses Venn diagrams to represent complex relationships such as the three pillars of sustainability?
Who was the mathematician who drew diagrams resembling Venn diagrams in the 1700s?
Who was the mathematician who drew diagrams resembling Venn diagrams in the 1700s?
In what book did the term 'Venn diagram' first appear?
In what book did the term 'Venn diagram' first appear?
What makes Venn diagrams versatile tools for visualizing relationships?
What makes Venn diagrams versatile tools for visualizing relationships?
Study Notes
Venn Diagram
A Venn diagram is an illustration that uses circles to show the relationship between two or more groups. These diagrams are commonly used in the fields of statistics, probability, mathematics, linguistics, logic, and computer science, and are also useful for project management. They were invented by British logician John Venn in 1880 and named after him.
Structure and Uses of Venn Diagrams
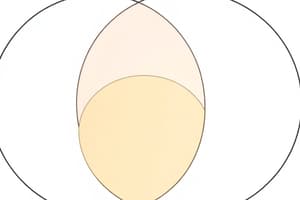
Venn diagrams consist of overlapping circles, with each circle representing a single set or item. The shared areas of the circles represent the similarities between groups, while the non-overlapping areas represent the differences. They are particularly useful for illustrating the similarities and differences between various groups or concepts.
Venn diagrams are often used in presentations and reports to quickly communicate complex ideas. They can be simple or complex, depending on the number of circles and the level of detail required. For instance, a Venn diagram comparing two sets of objects, such as "whales" and "fish," might use two overlapping circles to show their shared and unique attributes.
Creating a Venn Diagram
To create a Venn diagram in Microsoft Office programs such as Excel, Outlook, PowerPoint, or Word, you can insert a SmartArt Diagram with a Venn layout. Start by adding text to the main circles and, if necessary, use text boxes to add text to the overlapping portions.
Venn diagrams can be formatted to change the layout, colors, and effects to enhance their appearance. To do this, right-click the diagram and select a layout option from the Layouts group under SmartArt Tools on the Design tab.
Venn Diagrams in Education
Venn diagrams are also used in educational settings to help students compare and contrast different concepts, such as comparing traits in fiction and nonfiction books. They are particularly useful for visualizing relationships and can be used in conjunction with other teaching methods, such as discussions and group activities.
Venn Diagrams in Science
In the field of earth and planetary sciences, Venn diagrams are used to represent complex relationships, such as the three pillars of sustainability and their interconnectedness.
Venn Diagrams in Business
Venn diagrams are also used in business settings to compare and contrast different aspects of projects, such as the responsibilities of different teams or the performance of different products.
Historical Evolution of Venn Diagrams
The earliest diagrams that resemble Venn diagrams were drawn by Leonard Euler in the 1700s, with the term "Venn diagram" first appearing in Clarence Irvine Lewis's 1918 book, "A Survey of Symbolic Logic". Over time, Venn diagrams have been refined and adopted in various disciplines, aided by evolving technology and the use of computers.
In conclusion, Venn diagrams are versatile and powerful tools for visualizing relationships and comparing similarities and differences between various groups or concepts. They have been used in a variety of fields for over a century and continue to be a valuable tool for communication and understanding complex relationships.
Studying That Suits You
Use AI to generate personalized quizzes and flashcards to suit your learning preferences.
Description
Explore the structure, uses, and applications of Venn diagrams in various fields such as statistics, mathematics, science, education, and business. Learn how to create Venn diagrams in Microsoft Office programs and how they are utilized to visualize relationships and compare concepts.