Podcast
Questions and Answers
In a survey, 60% of people like apples, 50% like bananas, and 20% like both. Given a randomly selected person likes at least one of the fruits, what is the probability they like apples?
In a survey, 60% of people like apples, 50% like bananas, and 20% like both. Given a randomly selected person likes at least one of the fruits, what is the probability they like apples?
- 0.86
- 0.75
- 0.6 (correct)
- 0.92
In set theory, for any two sets A and B, it is always true that $(A - B) \cup (B - A) = A \cup B$.
In set theory, for any two sets A and B, it is always true that $(A - B) \cup (B - A) = A \cup B$.
False (B)
In a Venn diagram with three overlapping sets A, B, and C, what region represents elements that are in both A and B, but not in C?
In a Venn diagram with three overlapping sets A, B, and C, what region represents elements that are in both A and B, but not in C?
A ∩ B ∩ C'
In set theory, the operation that combines all elements from two sets into one, without duplicating common elements, is called the ______.
In set theory, the operation that combines all elements from two sets into one, without duplicating common elements, is called the ______.
A universal set U contains three subsets: A, B, and C. Given that n(U) = 200, n(A) = 80, n(B) = 70, n(C) = 90, n(A ∩ B) = 30, n(A ∩ C) = 25, n(B ∩ C) = 40, and n(A ∩ B ∩ C) = 15. What is the number of elements that are in none of the sets A, B, or C?
A universal set U contains three subsets: A, B, and C. Given that n(U) = 200, n(A) = 80, n(B) = 70, n(C) = 90, n(A ∩ B) = 30, n(A ∩ C) = 25, n(B ∩ C) = 40, and n(A ∩ B ∩ C) = 15. What is the number of elements that are in none of the sets A, B, or C?
Match the following set theory notations with their corresponding set operations:
Match the following set theory notations with their corresponding set operations:
In logical reasoning using Venn diagrams, if the diagram representing the premises of an argument allows for a scenario where the conclusion is false, the argument is considered ______.
In logical reasoning using Venn diagrams, if the diagram representing the premises of an argument allows for a scenario where the conclusion is false, the argument is considered ______.
A market research survey finds that 50% of consumers prefer product A, 40% prefer product B, and 20% prefer product C. Additionally, 15% prefer both A and B, 10% prefer both A and C, and 5% prefer all three products. If 60% of consumers prefer none of the products, what percentage of consumers prefer both B and C?
A market research survey finds that 50% of consumers prefer product A, 40% prefer product B, and 20% prefer product C. Additionally, 15% prefer both A and B, 10% prefer both A and C, and 5% prefer all three products. If 60% of consumers prefer none of the products, what percentage of consumers prefer both B and C?
If set A is equal to set B (A = B), then their symmetric difference (A Δ B) is the universal set U.
If set A is equal to set B (A = B), then their symmetric difference (A Δ B) is the universal set U.
How can Venn diagrams be used to solve logical syllogisms with universal and existential quantifiers?
How can Venn diagrams be used to solve logical syllogisms with universal and existential quantifiers?
If set A is a proper subset of set B, and set B is a proper subset of set C, which of the following statements is necessarily true regarding their Venn diagram representation?
If set A is a proper subset of set B, and set B is a proper subset of set C, which of the following statements is necessarily true regarding their Venn diagram representation?
In a three-set Venn diagram, if region 'X' represents the intersection of sets A and B, but excludes set C, how would you formally denote this set operation?
In a three-set Venn diagram, if region 'X' represents the intersection of sets A and B, but excludes set C, how would you formally denote this set operation?
A survey of 100 people reveals that 40 like coffee, 30 like tea, and 20 like both. How many people like neither coffee nor tea?
A survey of 100 people reveals that 40 like coffee, 30 like tea, and 20 like both. How many people like neither coffee nor tea?
Which of the following is a key limitation of using Venn diagrams to represent relationships between sets?
Which of the following is a key limitation of using Venn diagrams to represent relationships between sets?
In a Venn diagram, if circle A represents 'students who like math' and circle B represents 'students who like science', what does the area outside both circles (but within the universal set) represent?
In a Venn diagram, if circle A represents 'students who like math' and circle B represents 'students who like science', what does the area outside both circles (but within the universal set) represent?
In set theory, how is the symmetric difference between two sets A and B, denoted as $A \Delta B$, calculated?
In set theory, how is the symmetric difference between two sets A and B, denoted as $A \Delta B$, calculated?
What is the primary difference between a Venn diagram and an Euler diagram?
What is the primary difference between a Venn diagram and an Euler diagram?
In a Venn diagram, if set A represents 'people who own a car' and set B represents 'people who own a bicycle,' what does the intersection of A and B represent?
In a Venn diagram, if set A represents 'people who own a car' and set B represents 'people who own a bicycle,' what does the intersection of A and B represent?
How does increasing set numbers affect Venn diagram complexity, and how is this managed?
How does increasing set numbers affect Venn diagram complexity, and how is this managed?
What is the purpose of including cardinal numbers within a Venn diagram?
What is the purpose of including cardinal numbers within a Venn diagram?
Flashcards
Venn Diagrams
Venn Diagrams
Visual representations of sets and their relationships, used to solve problems involving overlapping sets and logical reasoning.
Set
Set
A collection of distinct objects considered as a single entity.
Universal Set (U)
Universal Set (U)
The set containing all possible elements under consideration.
Subset
Subset
Signup and view all the flashcards
Complement of a Set A (A')
Complement of a Set A (A')
Signup and view all the flashcards
Intersection of Sets A and B (A ∩ B)
Intersection of Sets A and B (A ∩ B)
Signup and view all the flashcards
Union of Sets A and B (A ∪ B)
Union of Sets A and B (A ∪ B)
Signup and view all the flashcards
n(A)
n(A)
Signup and view all the flashcards
A ⊆ B
A ⊆ B
Signup and view all the flashcards
A ≠ B
A ≠ B
Signup and view all the flashcards
Symmetric Difference (A Δ B)
Symmetric Difference (A Δ B)
Signup and view all the flashcards
Difference (A - B)
Difference (A - B)
Signup and view all the flashcards
Three-Set Venn Diagrams
Three-Set Venn Diagrams
Signup and view all the flashcards
Euler Diagrams
Euler Diagrams
Signup and view all the flashcards
Set Operations Algebra
Set Operations Algebra
Signup and view all the flashcards
Proper Subset (A ⊂ B)
Proper Subset (A ⊂ B)
Signup and view all the flashcards
Disjoint Sets
Disjoint Sets
Signup and view all the flashcards
Study Notes
- Venn diagrams are visual representations of sets and their relationships, useful for solving problems involving overlapping sets and logical reasoning.
- They use overlapping circles or other shapes to illustrate the relationships between sets.
Core Concepts of Venn Diagrams
- A set is a collection of distinct objects, considered as an object in its own right.
- An element is an individual object within a set.
- The universal set (U) is the set containing all possible elements under consideration.
- A subset is a set where all elements are also contained within a larger set.
- A proper subset of set B contains elements of set A and is a subset of B, and A is not equal to B.
- The complement of a set A (denoted as A') consists of all elements in the universal set that are not in A.
- The intersection of two sets A and B (denoted as A ∩ B) contains all elements that are common to both A and B.
- The union of two sets A and B (denoted as A ∪ B) contains all elements that are in A, or in B, or in both.
- The difference between two sets A and B, denoted as (A - B) or (A \ B) contains elements that belong to set A but not set B.
- The symmetric difference between sets A and B, denoted as A Δ B = (A ∪ B) - (A ∩ B), contains elements that belong to either A or B, but not to their intersection.
Constructing Venn Diagrams
- Draw a rectangle to represent the universal set.
- Draw circles within the rectangle to represent individual sets.
- The number of circles depends on the number of sets being compared, and more than 3 are possible.
- Overlapping regions of circles represent intersections of sets.
- Label each region to indicate which set(s) it represents and add elements or frequencies to the correct regions, leaving it blank if the region is empty.
Interpreting Venn Diagrams
- Each region of a Venn diagram represents a specific combination of sets and their complements.
- Focus on overlapping regions to determine intersections.
- Consider the universal set (U) and elements outside the circles.
- Pay attention to the question the Venn diagram should answer.
- To find the number of elements in a specific set, sum the values in all regions within that set's circle.
- To find the number of elements in the intersection of two or more sets, identify the overlapping region of their circles and note the value within.
- The number of elements in the union of two sets can be found by summing the values in each region of the circles, being careful not to double-count the intersection.
- An element outside of a set A means it belongs to the complement of A.
- The total number of elements is the sum of all values in all regions of the Venn diagram.
- "A and B" refers to the intersection of the sets, while "A or B" refers to their union.
Solving Problems with Venn Diagrams
- Read the problem carefully to understand the sets and relationships involved.
- Draw a Venn diagram with appropriate circles for each set.
- Start filling in the Venn diagram with the intersection of all sets.
- Work outwards, filling in the intersections of two sets, then single sets.
- Use the given data to determine the number of elements in each region.
- Use algebra to find unknowns.
- Answer the specific question asked, using the completed Venn diagram.
- Start by filling in the innermost intersection and work outwards when using cardinal numbers.
Applications in Statistics
- Venn diagrams visualize probabilities of events.
- Each circle represents an event, and the overlapping areas represent probabilities of events occurring together.
- P(A ∩ B) is the probability of both A and B occurring.
- P(A ∪ B) is the probability of A or B or both occurring.
- P(A') is the probability of A not occurring.
- In probability problems involving Venn diagrams, each region represents a probability rather than a count.
Logical Reasoning
- Venn diagrams can be used to assess the validity of logical arguments, especially syllogisms.
- Represent the premises of the argument using a Venn diagram.
- If the conclusion is necessarily true based on the diagram, then the argument is valid.
- If a counterexample can be found in the diagram, the argument is invalid.
Overlapping Sets
- Venn diagrams are useful for solving problems involving overlapping sets.
- Surveys where respondents may belong to multiple categories.
- Market research to understand customer preferences for multiple products.
Set Theory Notation
- n(A) represents the number of elements in set A.
- |A| represents the cardinal number of a set, the number of elements in set A.
- A ⊆ B means A is a subset of B.
- A = B means sets A and B are equal.
- A ≠ B means sets A and B are not equal.
- A Δ B = (A - B) ∪ (B - A) represents the symmetric difference between sets A and B.
Common Mistakes to Avoid
- Double-counting elements in overlapping regions when finding unions.
- Forgetting to subtract the intersection when finding the number of elements in only one set.
- Misinterpreting the question being asked.
- Incorrectly interpreting the notation of set theory.
- Not considering the universal set when finding complements.
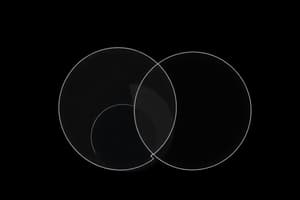
Two-Set Venn Diagrams
- The most basic type of Venn diagrams illustrates relationships between two sets.
- The diagram contains two overlapping circles inside a rectangle representing the universal set.
- The overlapping region represents the intersection of the two sets.
- There are four distinct regions: elements only in A, elements only in B, elements in both A and B, and elements in neither A nor B (but in U).
Three-Set Venn Diagrams
- Illustrate relationships between three sets.
- The diagram contains three overlapping circles inside a rectangle representing the universal set.
- There are eight distinct regions, representing all possible combinations of set membership.
- Allows for visualizing more complex relationships, including pairwise and triple intersections.
Applications of Venn Diagrams
- Visualizing set operations and relationships (union, intersection, complement, etc.) in set theory.
- Calculating probabilities of events and their combinations in probability.
- Representing logical statements and arguments and checking validity in logic.
- Categorizing data and identifying commonalities and differences between data sets in data analysis.
- Visualizing survey results and identifying overlapping opinions or characteristics for surveys.
- Performing database queries and data mining in computer science.
- Analyzing options and identifying common features or potential conflicts for decision making.
- Aiding in understanding and solving problems involving sets, categories, or groups for problem-solving.
- Illustrating how many customers like only A, A and B, all three, or none, for market research.
- Helping to visualize the number of customers in each category for database queries.
- Showing potential co-occurrence of symptoms for medical diagnosis.
- Representing the statement "All A are B" by circle A being entirely inside circle B in the Venn diagram for logical arguments.
Limitations of Venn Diagrams
- Can become complex and difficult to interpret with more than three or four sets.
- Do not effectively represent more complex relationships, such as hierarchies or networks.
- Visualization can be limited by the shapes used, typically circles.
- Sizes of the circles do not necessarily relate to the size of the sets they represent; they are only topological representations of the relationship between sets.
Alternatives to Venn Diagrams
- Euler Diagrams: Similar to Venn diagrams, but do not require all possible intersections to be represented.
- Concept Maps: Show relationships between concepts through nodes and links.
- Set Operations Algebra: Uses equations and formulas to represent set operations.
- Disjoint Sets: Sets that have no elements in common, with circles in the Venn diagram that do not overlap.
Studying That Suits You
Use AI to generate personalized quizzes and flashcards to suit your learning preferences.