Podcast
Questions and Answers
What does the guidance counselor say about the correlation between the number of extracurricular activities and grade point average?
What does the guidance counselor say about the correlation between the number of extracurricular activities and grade point average?
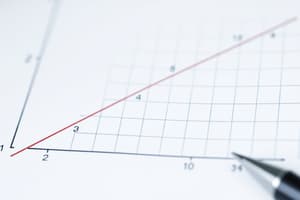
There is no linear relationship between number of activities and grade point average for students at this school.
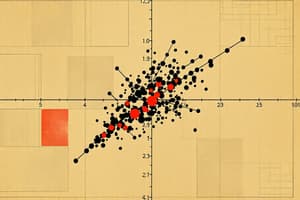
The statement 'The observation in the lower-right corner of the plot is influential for the least-squares line' is true.
The statement 'The observation in the lower-right corner of the plot is influential for the least-squares line' is true.
True (A)
What is the fraction of variation in values of y explained by the least-squares regression of y on x?
What is the fraction of variation in values of y explained by the least-squares regression of y on x?
The square of the correlation coefficient.
Which of the following statements is/are true regarding the least-squares regression analysis by a student conducting an experiment with quizzes?
Which of the following statements is/are true regarding the least-squares regression analysis by a student conducting an experiment with quizzes?
What was the activity level rating for the fish at a temperature of 20°C?
What was the activity level rating for the fish at a temperature of 20°C?
Interpret the value of s in the activity level ratings.
Interpret the value of s in the activity level ratings.
The correlation r between the lengths in inches and weights in pounds of a sample of brook trout is measured in inches.
The correlation r between the lengths in inches and weights in pounds of a sample of brook trout is measured in inches.
If the slope of the least-squares regression line is −0.44, what can we conclude about the correlation?
If the slope of the least-squares regression line is −0.44, what can we conclude about the correlation?
What is the predicted increase in temperature for an increase of 5 chirps per minute according to the model?
What is the predicted increase in temperature for an increase of 5 chirps per minute according to the model?
What effect would removing the data point for Ethiopia have on the regression line regarding people per television and per physician?
What effect would removing the data point for Ethiopia have on the regression line regarding people per television and per physician?
Flashcards are hidden until you start studying
Study Notes
Correlation and Relationships
- A correlation close to zero indicates no linear relationship between the number of extracurricular activities and student GPA.
- Influential observations in a scatterplot can significantly impact the least-squares regression line.
Regression Analysis
- The coefficient of determination (R²) is the square of the correlation coefficient, representing the fraction of variance explained.
- A least-squares regression line can be affected by variable choice, but correlation values remain unchanged with different explanatory variables.
Experimental Design
- Experimental setup can reveal dependencies by comparing performance on different quiz formats (calculator vs. paper-and-pencil).
- Standard deviation reflects variability; in this case, paper-and-pencil quiz scores had a larger standard deviation than calculator scores.
Activity Levels and Predictions
- Activity levels of fish examined at varying temperatures reveal specific ratings (e.g., 87 at 20°C) through regression analysis.
- The slope of standardized regression lines directly indicates the correlation; for example, a slope of -0.44 implies a correlation of -0.44.
Practical Applications
- Predictive models in biology, such as chirp count versus temperature, generate forecasts (e.g., a predicted temperature increase of 16.5°F for 5 extra chirps).
- Outliers, like extreme data points in socioeconomic studies, can skew regression outcomes; removing them may decrease slope and increase the y-intercept.
Studying That Suits You
Use AI to generate personalized quizzes and flashcards to suit your learning preferences.