Podcast
Questions and Answers
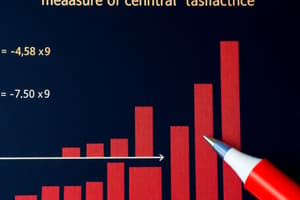
Which measure of central tendency is least affected by outliers in the data?
Which measure of central tendency is least affected by outliers in the data?
- Median (correct)
- All measures of central tendency are equally affected by outliers
- Mode
- Mean
Which measure of dispersion indicates how far apart the data points are from the center?
Which measure of dispersion indicates how far apart the data points are from the center?
- Variance
- Standard deviation (correct)
- Range
- All of the above
What is the formula to calculate the mean of a dataset?
What is the formula to calculate the mean of a dataset?
- Counting the number of unique values in the dataset
- Arranging the data in ascending order and selecting the middle value
- Sum of all data points divided by the number of data points (correct)
- Squaring the difference between each data point and the mean, then taking the average
Which measure of dispersion is calculated by taking the square root of the variance?
Which measure of dispersion is calculated by taking the square root of the variance?
Which of the following is not a measure of central tendency?
Which of the following is not a measure of central tendency?
What is the method used by statisticians to identify potential outliers in a dataset?
What is the method used by statisticians to identify potential outliers in a dataset?
Which measure of dispersion is expressed in the same units as the original dataset?
Which measure of dispersion is expressed in the same units as the original dataset?
If a dataset has an even number of observations, how is the median calculated?
If a dataset has an even number of observations, how is the median calculated?
What does a low variance indicate about the data points?
What does a low variance indicate about the data points?
Which measure is calculated as the difference between the third quartile and the first quartile?
Which measure is calculated as the difference between the third quartile and the first quartile?
Flashcards are hidden until you start studying
Study Notes
Introduction
In statistics, understanding the measures of central tendency and dispersion is crucial for analyzing data effectively. Central tendencies help determine the average value of a dataset, while measures of dispersion indicate how spread out the data is and how far apart the data points are from the center. Three measures of central tendency are commonly used: mean, median, and mode. Two measures of dispersion, variance and standard deviation, are frequently utilized. In this article, we delve into these key statistical concepts, discussing their importance, applications, and related tools for visualization and summarization of data.
Central Tendencies
Mean
The mean, also known as arithmetic mean or simply average, is arguably the most widely used measure of central tendency. It is calculated by summing up all the data points in a population or sample and dividing the total by the number of data points. The mean is sensitive to every value in the dataset, making it suitable for mathematical calculations. However, it can be heavily influenced by extreme values, known as outliers, leading to a skewed representation of the central tendency when dealing with such cases.
Median
The median is another measure of central tendency that is less affected by extreme values compared to the mean. It represents the middle value in a set of data when arranged in ascending order of magnitude. If the dataset contains an odd number of observations, the median is simply the value located at the center. For datasets with an even number of observations, the median is calculated as the average of the two middle values.
Mode
The mode refers to the most frequent value in a dataset. It is particularly useful when dealing with categorical data or when identifying groups with similar characteristics.
Measures of Dispersion
Variance
Variance is a measure of dispersion that measures the spread of the data around the mean. It is calculated as the average of the squared differences from the mean. High variance indicates that the data points are spread far apart from the mean, indicating greater variability. On the other hand, low variance suggests that the data points are clustered around the mean, signifying lesser variability. Variance can be heavily influenced by extreme values, making it less reliable in the presence of outliers.
Standard Deviation
Standard deviation is a preferred measure of dispersion over variance because it is expressed in the same units as the original dataset, making interpretation easier. It is simply the square root of variance. A low standard deviation indicates that the data points are tightly clustered around the mean, while a high standard deviation suggests greater spread apart from the mean. Like variance, standard deviation is also sensitive to extreme values or outliers.
Dealing with Outliers
Outliers are extreme values that significantly impact measures of central tendency and dispersion. To account for their presence, statisticians use methods like the interquartile range (IQR). IQR represents the difference between the third quartile (Q3) and the first quartile (Q1). By setting upper and lower fences based on Q1 and Q3, respectively, we can identify data points outside these ranges as potential outliers, allowing us to remove them from further analysis.
Visualizing and Summarizing Data
Boxplots or box and whisker plots are commonly used to visualize the five-number summary of a dataset. They display minimum and maximum values, median, first and third quartiles as a box with whiskers extending from it. Outliers not captured by the whiskers appear individually outside the plot. Boxplots provide an effective tool for comparing data across different categories or groups.
In conclusion, understanding central tendencies and measures of dispersion is essential for statistical analysis. By utilizing these concepts effectively, alongside related visualization techniques, statisticians can gain valuable insights into datasets and make informed decisions based on accurate representations of their data's distribution.
Studying That Suits You
Use AI to generate personalized quizzes and flashcards to suit your learning preferences.