Podcast
Questions and Answers
What does a lower ICC (Intraclass Correlation Coefficient) indicate about data clustering?
What does a lower ICC (Intraclass Correlation Coefficient) indicate about data clustering?
- Data do not exhibit any variance.
- There is less tight clustering in the data. (correct)
- There is a high level of clustering in the data.
- Data is completely independent.
Complete pooling ignores differences among clusters.
Complete pooling ignores differences among clusters.
True (A)
What is the main advantage of using partial pooling in multilevel models?
What is the main advantage of using partial pooling in multilevel models?
It borrows strength from the entire dataset to provide more reliable estimates.
In a multilevel study design, students are considered Level 1, while __________ are considered Level 2.
In a multilevel study design, students are considered Level 1, while __________ are considered Level 2.
Match the following terms with their definitions:
Match the following terms with their definitions:
Which approach in multilevel modeling is most appropriate when you want to analyze data that is hierarchical?
Which approach in multilevel modeling is most appropriate when you want to analyze data that is hierarchical?
Long data formats have each observation of the outcome in separate columns.
Long data formats have each observation of the outcome in separate columns.
What is the primary goal of multilevel models in research?
What is the primary goal of multilevel models in research?
What do random effects models account for in multilevel modeling?
What do random effects models account for in multilevel modeling?
In a random intercepts model, each group shares the same intercept.
In a random intercepts model, each group shares the same intercept.
What function in R is commonly used to fit multilevel models?
What function in R is commonly used to fit multilevel models?
The ______ effect in a mixed effects model assumes that the effect of predictors is constant across all groups.
The ______ effect in a mixed effects model assumes that the effect of predictors is constant across all groups.
Match each term with its correct description:
Match each term with its correct description:
Which symbol in the random slopes model indicates how the effect of a predictor varies by group?
Which symbol in the random slopes model indicates how the effect of a predictor varies by group?
In multilevel models, the random slopes and intercepts are assumed to be normally distributed.
In multilevel models, the random slopes and intercepts are assumed to be normally distributed.
Define the term 'residual error' in the context of multilevel modeling.
Define the term 'residual error' in the context of multilevel modeling.
What does the intercept (b0) in a simple linear regression model represent?
What does the intercept (b0) in a simple linear regression model represent?
The Residual Sum of Squares measures the total deviance of predicted scores from the mean of y.
The Residual Sum of Squares measures the total deviance of predicted scores from the mean of y.
What is the purpose of the Coefficient of Determination (R²) in a regression model?
What is the purpose of the Coefficient of Determination (R²) in a regression model?
The difference between observed values and predicted values in a model is known as __________.
The difference between observed values and predicted values in a model is known as __________.
What does the F test in a regression model assess?
What does the F test in a regression model assess?
Interactions in a linear regression indicate that the relationship between x1 and y is constant regardless of the value of x2.
Interactions in a linear regression indicate that the relationship between x1 and y is constant regardless of the value of x2.
In the context of regression, what does 'null model' refer to?
In the context of regression, what does 'null model' refer to?
Flashcards
Simple Linear Regression
Simple Linear Regression
The relationship between two continuous variables is examined by fitting a straight line to the data points.
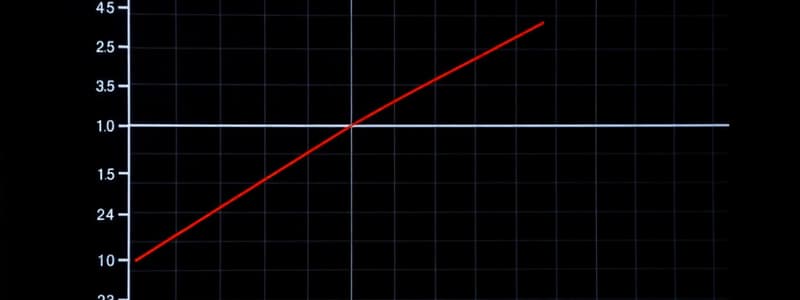
Intercept (b0)
Intercept (b0)
The value of y when x is equal to 0; where the line crosses the y-axis.
Slope (b1)
Slope (b1)
The change in y for every one-unit increase in x; the steepness of the line.
Residuals (ε)
Residuals (ε)
Signup and view all the flashcards
Coefficient of Determination (R²)
Coefficient of Determination (R²)
Signup and view all the flashcards
Total Sum of Squares (TSS)
Total Sum of Squares (TSS)
Signup and view all the flashcards
Residual Sum of Squares (RSS)
Residual Sum of Squares (RSS)
Signup and view all the flashcards
Model Sum of Squares (MSS)
Model Sum of Squares (MSS)
Signup and view all the flashcards
Fixed Effect
Fixed Effect
Signup and view all the flashcards
Random Effect
Random Effect
Signup and view all the flashcards
Multilevel Modeling (MLM)
Multilevel Modeling (MLM)
Signup and view all the flashcards
Random Intercepts Model
Random Intercepts Model
Signup and view all the flashcards
Random Slopes Model
Random Slopes Model
Signup and view all the flashcards
β0 (Overall Intercept)
β0 (Overall Intercept)
Signup and view all the flashcards
β1 (Slope of Predictor)
β1 (Slope of Predictor)
Signup and view all the flashcards
u0j (Random Intercept)
u0j (Random Intercept)
Signup and view all the flashcards
Wide Data
Wide Data
Signup and view all the flashcards
Long Data
Long Data
Signup and view all the flashcards
Complete Pooling
Complete Pooling
Signup and view all the flashcards
No Pooling
No Pooling
Signup and view all the flashcards
Partial Pooling
Partial Pooling
Signup and view all the flashcards
Multilevel Model
Multilevel Model
Signup and view all the flashcards
Intraclass Correlation Coefficient (ICC)
Intraclass Correlation Coefficient (ICC)
Signup and view all the flashcards
Hierarchical Data
Hierarchical Data
Signup and view all the flashcards
Study Notes
Simple Linear Regression
- Simple linear regression analyzes the relationship between two continuous variables.
- It fits a straight line through data points.
- The equation for a simple linear regression is y = b0 + b1 * x + ε.
- y is the dependent variable (outcome).
- x is the independent variable (predictor).
- b0 is the intercept (value of y when x = 0).
- b1 is the slope (change in y for a one-unit increase in x).
- ε represents residuals or errors in prediction.
Interactions
- The relationship between one set of variables depends on the level of another variable.
- It involves adding an interaction term that impacts the effect of a variable based on another variable’s level.
- Example: The effect of x1 on y is now (b1 + b3 * x2) -- some number (b1) plus another number (b3) that changes depending on x2.
Inferential Statistics
- Judgment about the parameters of a population.
- Involves quantifying and understanding the variance of a model.
Coefficient of Determination (R²)
- Measures the quality of the model.
- It quantifies the proportion of variance in the outcome variable that’s explained by the predictors.
- R² is calculated as SS(Model)/ SS(Total) = 1 – SS(Residual) / SS(Total).
- A higher R² suggests a better model fit.
Total Sum of Squares (SSTotal)
- Represents the total variability in the outcome variable.
- Calculated as the squared distances between each data point and the mean of the outcome variable.
Residual Sum of Squares (SSResidual)
- Measured as the squared distances between observed and predicted values.
- Represents the variation in the outcome variable not captured by the model.
Model Sum of Squares (SSModel)
- Represents the variation in the outcome variable explained by the predictors.
Studying That Suits You
Use AI to generate personalized quizzes and flashcards to suit your learning preferences.


