Podcast
Questions and Answers
What is a frequency distribution?
What is a frequency distribution?
- A measure of central tendency
- A table showing classes or intervals of data with counts (correct)
- A method for calculating averages
- A type of bar graph representing frequencies
What does frequency (f) represent?
What does frequency (f) represent?
Number of data entries in the class
What is the first step in constructing a frequency distribution?
What is the first step in constructing a frequency distribution?
Determine the number of classes (5-20)
What are class limits?
What are class limits?
What is relative frequency?
What is relative frequency?
What does cumulative frequency represent?
What does cumulative frequency represent?
What is a frequency histogram?
What is a frequency histogram?
How are class boundaries calculated?
How are class boundaries calculated?
What is the method for calculating the midpoint of a class?
What is the method for calculating the midpoint of a class?
What is an ogive?
What is an ogive?
What is central tendency?
What is central tendency?
What is the mean in statistics?
What is the mean in statistics?
How is median defined?
How is median defined?
What does mode represent?
What does mode represent?
Flashcards are hidden until you start studying
Study Notes
Frequency Distribution
- A frequency distribution organizes data into classes or intervals with counts for each class.
Frequency (f)
- Frequency represents the number of data entries within a specific class.
Constructing a Frequency Distribution
- Aim for 5 to 20 classes when creating a frequency distribution.
- Class width is determined by dividing the data range by the number of classes.
- Establish class limits; create tally marks for data entries within each class.
- Count tally marks to find the frequency for each class.
Class Limits
- The lower limit of the first class is the smallest data entry.
- Subsequent lower limits are derived by adding the class width to the previous class's lower limit.
- The upper limit for each class must ensure there is no overlap with adjacent classes.
Problem-Solving Steps for Data
- Identify the highest and lowest values in the data set, and calculate the range.
- Divide the range by the number of groups to find class width, rounding up if necessary.
- List all class limits starting from the lowest value, adjusting upper limits to avoid overlap.
- Use tally marks to record occurrences within each price range.
Relative Frequency
- Relative frequency represents the proportion or percentage of the data that falls into a specific class, calculated as class frequency divided by the sample size.
Cumulative Frequency
- Cumulative frequency is the running total of frequencies for a class and all preceding classes.
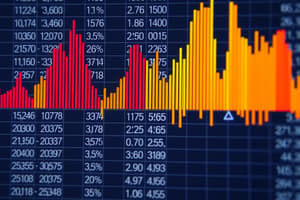
Frequency Histogram
- A graphical representation of frequency distribution using bars; horizontal axis for data values and vertical axis for frequency in classes.
Class Boundaries
- Class boundaries prevent gaps between classes, achieved by adjusting lower boundaries downward and upper boundaries upward by 0.5.
Midpoint
- The midpoint of a class is calculated by averaging its upper and lower limits.
Frequency Polygon
- A line graph depicting changes in frequency, starting and ending on the horizontal axis.
Relative Frequency Histogram
- Similar to a regular histogram, but the vertical axis represents relative frequencies as percentages.
Ogive (Cumulative Frequency Graph)
- A line graph representing cumulative frequency plotted against class boundaries.
Stem and Leaf Plot
- This plot separates numbers into a 'stem' (leading digits) and 'leaf' (trailing digits), facilitating visualization and sorting.
Dot Plot
- A visual representation where data values are indicated with dots above a number line.
Pie Chart
- A circle divided into sectors to represent categories; the area of each sector correlates with its frequency.
- Central angle of each sector is calculated as 360 degrees multiplied by its relative frequency.
Pareto Chart
- A bar graph showing frequency or relative frequency, arranged in descending order, with the tallest bar positioned on the left.
Paired Data Sets
- Each entry in one data set corresponds to another in a second data set, typically represented in scatter plots to demonstrate relationships between two quantifiable variables.
Time Series Graph
- A display of quantitative entries tracked over regular intervals; typically, dates are presented in order on the horizontal axis, with a line graph illustrating trends over time.
Central Tendency
- Measures the typical or central entry of a data set, calculable by mean, median, or mode.
Mean
- The mean is the average value computed by summing all entries and dividing by the number of entries.
Sigma Notation
- Represents the sum of all entries in a data set using the symbol ∑.
Median
- The median divides an ordered data set into two equal halves; it is the middle number for an odd count of entries and the average of the two middle numbers for an even count.
Mode
- The mode is identified as the entry with the greatest frequency; no mode exists if there are no repeats, and multiple modes occur if multiple entries appear with equal highest frequency.
Studying That Suits You
Use AI to generate personalized quizzes and flashcards to suit your learning preferences.