Podcast
Questions and Answers
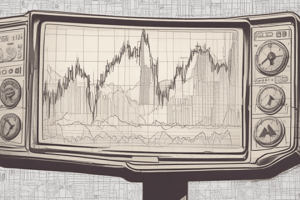
In the diagram, price creates another ______ area or rather a supply zone which is represented by the white line.
In the diagram, price creates another ______ area or rather a supply zone which is represented by the white line.
resistance
The red circle in the diagram indicates a ______ grab when price broke through the resistance and then came back down.
The red circle in the diagram indicates a ______ grab when price broke through the resistance and then came back down.
liquidity
The previous chart showed a ______ breakout, which is when price breaks through the resistance and then comes back down.
The previous chart showed a ______ breakout, which is when price breaks through the resistance and then comes back down.
false
Once we identify the liquidity grab, we should look for a ______ of character in the chart.
Once we identify the liquidity grab, we should look for a ______ of character in the chart.
The last higher low before price goes up and failed to break past is an example of a ______ of character.
The last higher low before price goes up and failed to break past is an example of a ______ of character.
When price came back down and broke through the last higher low, it gave us a ______ of character.
When price came back down and broke through the last higher low, it gave us a ______ of character.
The white line in the diagram represents a ______ zone.
The white line in the diagram represents a ______ zone.
A break of structure is a significant change in the ______ of the price movement.
A break of structure is a significant change in the ______ of the price movement.
The identification of a false breakout is a sign of a possible ______ reversal.
The identification of a false breakout is a sign of a possible ______ reversal.
The chart pattern shows a ______ of the resistance area, which indicates a potential trading opportunity.
The chart pattern shows a ______ of the resistance area, which indicates a potential trading opportunity.
Flashcards
Resistance Area
Resistance Area
A price level where buying pressure is strong enough to prevent the price from rising further.
Liquidity Grab
Liquidity Grab
A strong buying or selling pressure that shows up as a price spike.
False Breakout
False Breakout
A temporary price movement that does not lead to a sustained change in the price trend.
Change of Character
Change of Character
Signup and view all the flashcards
Supply Zone
Supply Zone
Signup and view all the flashcards
Break of Structure
Break of Structure
Signup and view all the flashcards
Trend Reversal
Trend Reversal
Signup and view all the flashcards
Break of Resistance
Break of Resistance
Signup and view all the flashcards
Higher Low
Higher Low
Signup and view all the flashcards
Supply Zone
Supply Zone
Signup and view all the flashcards
False Breakout
False Breakout
Signup and view all the flashcards
Resistance
Resistance
Signup and view all the flashcards
Liquidity
Liquidity
Signup and view all the flashcards
Change of Character
Change of Character
Signup and view all the flashcards
Break of Resistance
Break of Resistance
Signup and view all the flashcards
Trend
Trend
Signup and view all the flashcards
Study Notes
Smart Money Concepts Trading Strategy
- A downtrend will eventually lose momentum and reverse back up, creating a change of character.
- The strategy involves identifying the break of structure and change of character.
Area of Interest
- The area of interest is a supply and demand zone, marked in red, and should be as strong as possible.
- A strong area of interest is a price level where the market is likely to make a significant change in direction due to immense orders/liquidity.
Identifying a Strong Area of Interest
- Two methods can be used to identify a strong area of interest:
- Liquidity grab at a supply or demand zone
- Identifying order blocks by looking for strong reversals on a higher time frame (1-hour or above)
Order Blocks
- Order blocks are levels indicated by white horizontal lines, where price reverses strongly when reaching them.
- Examples of order blocks can be seen in the diagram, marked by yellow arrows.
Smart Money Concepts Trading Strategy in Action
- The strategy involves combining the identified areas of interest with examples to create a high-win-rate trading strategy.
- A false breakout is identified when price breaks through a resistance and then comes back down.
- A liquidity grab is identified when price breaks through a resistance and creates a false breakout.
- A change of character is identified when price reverses and creates a new higher low or lower high.
Studying That Suits You
Use AI to generate personalized quizzes and flashcards to suit your learning preferences.