Podcast
Questions and Answers
What is the main purpose of a Gantt chart in project time management?
What is the main purpose of a Gantt chart in project time management?
- To ensure that all activities are planned for, their order of performance is accounted for, and activity time estimates are recorded (correct)
- To develop a cash flow statement
- To illustrate interrelationships and dependencies between activities and resources
- To create a work breakdown structure (WBS)
What should be established before creating a Gantt chart?
What should be established before creating a Gantt chart?
- Work breakdown structure (WBS) (correct)
- Procurement schedule
- Resource histogram
- Network diagram
What do the thick bars represent in a Gantt chart?
What do the thick bars represent in a Gantt chart?
- Milestones
- Resource allocation
- Dependencies between activities
- Activities' duration (correct)
What is a limitation of Gantt charts?
What is a limitation of Gantt charts?
What is the calendar timescale in a Gantt chart typically shown in?
What is the calendar timescale in a Gantt chart typically shown in?
What should a Gantt chart be developed as for the procurement schedule, resource histogram, and cash flow statement?
What should a Gantt chart be developed as for the procurement schedule, resource histogram, and cash flow statement?
What do the thin connecting arrows represent in a Gantt chart?
What do the thin connecting arrows represent in a Gantt chart?
What is the benefit of using a Gantt chart in project time management?
What is the benefit of using a Gantt chart in project time management?
What is an activity float in a Gantt chart?
What is an activity float in a Gantt chart?
Why are some project managers reluctant to show activity floats in a Gantt chart?
Why are some project managers reluctant to show activity floats in a Gantt chart?
What is the purpose of a hammock in a Gantt chart?
What is the purpose of a hammock in a Gantt chart?
What is an event in a Gantt chart?
What is an event in a Gantt chart?
What is the line of balance technique used for?
What is the line of balance technique used for?
What is the purpose of a revised Gantt chart?
What is the purpose of a revised Gantt chart?
What is the main purpose of a Rolling Horizon Gantt chart?
What is the main purpose of a Rolling Horizon Gantt chart?
What is a major limitation of using a rolling horizon Gantt chart on its own?
What is a major limitation of using a rolling horizon Gantt chart on its own?
What is the main purpose of a Trend Gantt chart?
What is the main purpose of a Trend Gantt chart?
Why is sorting an iterative process?
Why is sorting an iterative process?
At what level can a Trend Gantt chart be drawn to limit the number of activities?
At what level can a Trend Gantt chart be drawn to limit the number of activities?
What is the benefit of subdividing scope into milestones?
What is the benefit of subdividing scope into milestones?
What is the purpose of incorporating a network diagram with a production schedule?
What is the purpose of incorporating a network diagram with a production schedule?
What is a characteristic of a Logic Gantt chart?
What is a characteristic of a Logic Gantt chart?
What is one of the benefits of using a Gantt chart?
What is one of the benefits of using a Gantt chart?
What is a prerequisite for forecasting the procurement schedule and cash flow statement?
What is a prerequisite for forecasting the procurement schedule and cash flow statement?
What is one of the shortcomings of a Gantt chart?
What is one of the shortcomings of a Gantt chart?
What does a Gantt chart ultimately show?
What does a Gantt chart ultimately show?
Study Notes
Gantt Charts in Project Time Management
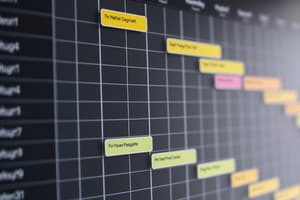
- Gantt charts provide a standard format for displaying schedule information by listing activities with their corresponding start and finish dates on a calendar.
- Activities listed should coincide with the information on the WBS, activity, and milestone lists.
- Low-cost and easy to understand, Gantt charts use horizontal bars to depict each project activity along a timeline.
- Key purposes of Gantt charts include:
- Ensuring all activities are planned for
- Accounting for the order of performance
- Recording activity time estimates
- Developing overall project time
Drawing a Gantt Chart
- Tabular reports provide the structure to present information, which should be used in conjunction with other planning documents.
- It's a good idea to establish the WBS before creating a Gantt chart.
- A simple Gantt chart example is shown for a house-building project, with activity data listed and depicted with a calendar timescale.
Features of a Gantt Chart
- An activity float shows a ‘float’ at the end of an activity from early finish to late finish, denoted as a dotted line with a symbol (usually a diamond or upturned triangle) at the end.
- Some software packages allow for ‘select’ or ‘filter’, ‘sort’ or ‘order’ functions to aid in formatting.
- A hammock is a summary activity that gathers together a number of sub-activities into one master activity, which can link with the WBS.
- An event is a key point in time with zero duration, also called a keydate or milestone, which gives focus to when work must be completed and provides a clear measure of progress.
Variations of the Gantt Chart
- Revised Gantt chart: actual progress can be marked on the original plan, drawn above, inside, or underneath the original bar, to establish progress trends.
- Rolling Horizon Gantt chart: a simplified chart focusing on a short period ahead, based on the latest data, and worked on by someone close to the center of action.
- Trend Gantt chart: a progress trend chart showing the direction and trend of a project at a glance, drawn by hand on the original Gantt chart and photocopied for circulation.
- Logic Gantt chart: shows activity logical relationships explicitly in Gantt chart format, appropriate for modest-sized projects.
Benefits of the Gantt Chart
- Easy to assimilate chart presentation
- Displays activity progress very simply and clearly
- Activity float is easier to comprehend when displayed using a Gantt chart
- Scheduled Gantt chart is a prerequisite for forecasting procurement schedule and cash flow statement
- Revised Gantt chart is an excellent management tool
- Can be used to communicate and disseminate schedule information
- Key document for management decision-making function
Shortcomings of Gantt Charts
- Does not adequately illustrate interrelationships and dependencies between activities and resources
- Limited in multiple decision-making situations
Studying That Suits You
Use AI to generate personalized quizzes and flashcards to suit your learning preferences.
Description
This quiz covers the basics of Gantt charts, a visual tool used in project time management to display schedule information and ensure all activities are accounted for.


