Podcast
Questions and Answers
Mind mapping is an effective way to facilitate ______, note taking and project planning.
Mind mapping is an effective way to facilitate ______, note taking and project planning.
ideation
Mind mapping generally starts with a simple ______ or topic in the center.
Mind mapping generally starts with a simple ______ or topic in the center.
idea
A ______ approach to note-taking is a key concept of mind mapping.
A ______ approach to note-taking is a key concept of mind mapping.
nonlinear
To aid thinking at the beginning of the ______ process is one of the importance of mapping.
To aid thinking at the beginning of the ______ process is one of the importance of mapping.
When mind mapping, it's essential to put down only ______ or short phrases, not sentences.
When mind mapping, it's essential to put down only ______ or short phrases, not sentences.
Info-graphics are a visual representation of ______.
Info-graphics are a visual representation of ______.
Students creating info-graphics are using ______, visual, and technology literacies.
Students creating info-graphics are using ______, visual, and technology literacies.
This type of info graph consists of content in a ______ format.
This type of info graph consists of content in a ______ format.
Mind mapping is a visual tool for generating and organizing ______.
Mind mapping is a visual tool for generating and organizing ______.
When mind mapping, it's essential to have at least ______ related ideas coming out of your main topic.
When mind mapping, it's essential to have at least ______ related ideas coming out of your main topic.
You want to have more than ______ levels of idea generation when mind mapping.
You want to have more than ______ levels of idea generation when mind mapping.
Info-graphics are a combination of ______, visual, and technology literacies.
Info-graphics are a combination of ______, visual, and technology literacies.
When creating a mind map, you should write whatever ______ to mind.
When creating a mind map, you should write whatever ______ to mind.
A key aspect of mind mapping is to reveal ______, themes, and associations between ideas.
A key aspect of mind mapping is to reveal ______, themes, and associations between ideas.
Mind mapping helps to generate the ______ terms needed to do research.
Mind mapping helps to generate the ______ terms needed to do research.
You should build on each idea at this ______ level by drawing 3–4 lines from the word or phrase.
You should build on each idea at this ______ level by drawing 3–4 lines from the word or phrase.
When drawing a mind map, you should use ______ or images, not sentences.
When drawing a mind map, you should use ______ or images, not sentences.
Creating info-graphics helps students showcase their mastery of ______.
Creating info-graphics helps students showcase their mastery of ______.
Flashcards are hidden until you start studying
Study Notes
Mind Mapping
- Mind mapping is an effective way to facilitate ideation, note-taking, and project planning.
- It starts with a simple idea or topic in the center and involves putting related ideas around it, connected with lines.
- A visual tool for generating and organizing ideas, nonlinear approach to note-taking, and a way to investigate and record aspects of a multi-faceted topic.
- It triggers quick word associations and helps in thinking at the beginning of the research process.
- It creates a visual overview of a topic, develops questions, reveals patterns, themes, and associations between ideas, and generates search terms for research.
Tips for Effective Mind Mapping
- Use only keywords, short phrases, or images, not sentences.
- Write whatever comes to mind, allowing for natural brain function.
- Generate at least 5 related ideas from the main topic, and build on each idea with 3-4 lines.
- Aim for more than 4 "rings" or levels of ideas.
- What's written down doesn't need to be related to the main topic.
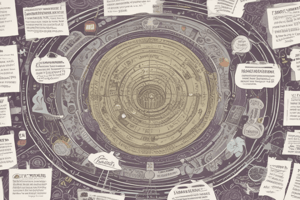
Info-graphics
- Info-graphics are a visual representation of data.
- They require information, visual, and technology literacies.
- They can be used for formative or summative assessments to showcase knowledge mastery.
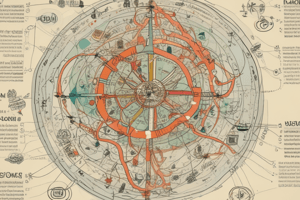
Types of Info-graphics
- List-based info-graph (content in a list format)
- Comparison info-graph (comparing data or information)
- Visual article info-graph (visual representation of an article)
- Interactive info-graph (allows user interaction)
- Data visualization info-graph (visual representation of data)
- Timeline info-graph (visual representation of events in chronological order)
- Visual resume info-graph (visual representation of a resume)
Examples of Info-graphics
- List-based info-graph (e.g., steps to follow to reach a certain end goal)
Mind Mapping
- Mind mapping is an effective way to facilitate ideation, note-taking, and project planning.
- It starts with a simple idea or topic in the center and involves putting related ideas around it, connected with lines.
- A visual tool for generating and organizing ideas, nonlinear approach to note-taking, and a way to investigate and record aspects of a multi-faceted topic.
- It triggers quick word associations and helps in thinking at the beginning of the research process.
- It creates a visual overview of a topic, develops questions, reveals patterns, themes, and associations between ideas, and generates search terms for research.
Tips for Effective Mind Mapping
- Use only keywords, short phrases, or images, not sentences.
- Write whatever comes to mind, allowing for natural brain function.
- Generate at least 5 related ideas from the main topic, and build on each idea with 3-4 lines.
- Aim for more than 4 "rings" or levels of ideas.
- What's written down doesn't need to be related to the main topic.
Info-graphics
- Info-graphics are a visual representation of data.
- They require information, visual, and technology literacies.
- They can be used for formative or summative assessments to showcase knowledge mastery.
Types of Info-graphics
- List-based info-graph (content in a list format)
- Comparison info-graph (comparing data or information)
- Visual article info-graph (visual representation of an article)
- Interactive info-graph (allows user interaction)
- Data visualization info-graph (visual representation of data)
- Timeline info-graph (visual representation of events in chronological order)
- Visual resume info-graph (visual representation of a resume)
Examples of Info-graphics
- List-based info-graph (e.g., steps to follow to reach a certain end goal)
Studying That Suits You
Use AI to generate personalized quizzes and flashcards to suit your learning preferences.