Podcast
Questions and Answers
What does the universal set represent in a Venn diagram?
What does the universal set represent in a Venn diagram?
- The set with the least number of elements
- All possible elements under consideration (correct)
- The intersection of all sets
- A subset of one of the sets
Which feature of Venn diagrams primarily aids in showcasing shared elements between sets?
Which feature of Venn diagrams primarily aids in showcasing shared elements between sets?
- Overlapping regions (correct)
- Non-overlapping regions
- Independent shapes
- An external rectangle
Which of the following is NOT an application of Venn diagrams?
Which of the following is NOT an application of Venn diagrams?
- Economic forecasting (correct)
- Logical reasoning
- Probability analysis
- Data visualization
What is a primary advantage of using Venn diagrams?
What is a primary advantage of using Venn diagrams?
What limitation do Venn diagrams have when representing multiple sets?
What limitation do Venn diagrams have when representing multiple sets?
Which of the following best describes a three-set Venn diagram?
Which of the following best describes a three-set Venn diagram?
How do non-overlapping regions in a Venn diagram function?
How do non-overlapping regions in a Venn diagram function?
In constructing a Venn diagram, what is the first step in the process?
In constructing a Venn diagram, what is the first step in the process?
Flashcards
What is a Venn Diagram?
What is a Venn Diagram?
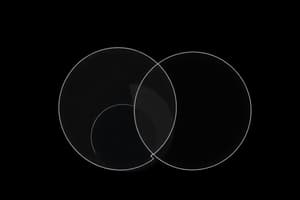
A visual representation of the relationships between different sets of data using overlapping circles.
What do overlapping regions in a Venn Diagram represent?
What do overlapping regions in a Venn Diagram represent?
A visual representation illustrating how elements are shared or unique across sets.
What is the universal set?
What is the universal set?
The collection of all elements being considered in a Venn Diagram.
What is a two-set Venn Diagram?
What is a two-set Venn Diagram?
Signup and view all the flashcards
What is a three-set Venn Diagram?
What is a three-set Venn Diagram?
Signup and view all the flashcards
What are some applications of Venn Diagrams?
What are some applications of Venn Diagrams?
Signup and view all the flashcards
What are the advantages of using Venn Diagrams?
What are the advantages of using Venn Diagrams?
Signup and view all the flashcards
What are some limitations of Venn Diagrams?
What are some limitations of Venn Diagrams?
Signup and view all the flashcards
Study Notes
Introduction to Venn Diagrams
- Venn diagrams are visual representations of the relationships between different sets of data.
- They use overlapping circles to show how elements are shared or unique across those sets.
- Primarily used in set theory to illustrate set relationships.
Basic Components of Venn Diagrams
- Circles or other shapes represent sets.
- Overlapping regions represent the intersection of sets (elements common to both).
- Non-overlapping regions represent elements unique to each set.
- Universal set (often represented by a rectangle) encompasses all elements being considered.
Constructing Venn Diagrams
- Identify sets involved (e.g., set A, set B, set C).
- Determine relationships between sets (e.g., subsets, disjoint sets, overlapping sets).
- Elements in the universal set are allocated to regions of the diagram based on the sets they belong to.
Types of Venn Diagrams
- Two-set Venn diagrams: Illustrate relationships between two sets.
- Three-set Venn diagrams: Illustrate relationships among three sets.
Applications of Venn Diagrams
- Data analysis: Representing and visualizing relationships between categories of data.
- Problem-solving: Identifying overlaps or differences in problem statements.
- Education: Explaining set theory and logic.
- Probability: Calculating probabilities of events occurring in a context with multiple possible states.
- Decision theory: Deciding which choice or option can be applied given multiple situations.
- Set theory: Basic illustrations in set theory concepts.
- Logic: Graphical representation in deductive arguments or propositional logic.
Advantages of Using Venn Diagrams
- Visual clarity: Easy to understand and interpret.
- Concise representation: Simplifies complex relationships between data.
- Problem-solving tool: Aids in analyzing complex situations or problems.
- Communication: Effective means to communicate complex information or problems.
- Pattern recognition: Helps identifying patterns or relationships in data.
- Logical reasoning ability: Allows the establishment of relationships more easily.
Limitations of Venn Diagrams
- Complexity: Difficult to represent relationships between more than a few sets.
- Data scale: Unpractical for massive datasets.
- Subjectivity: Interpretation can vary among observers.
- Limitation for nuanced relationships: Limited representation of very intricate relationships.
Key Concepts and Terms
- Universal set: All possible elements under consideration.
- Union: Combination of sets (all elements from any of the sets).
- Intersection: Comprises elements common to all involved sets.
- Complement: Elements in the universal set, but not in a given set.
- Subset: A subset contains every element of the smaller set that is also an element in the larger set. Disjoint sets do not share any common elements.
Studying That Suits You
Use AI to generate personalized quizzes and flashcards to suit your learning preferences.