Podcast
Questions and Answers
Which of the following is NOT a typical component assessed in the IGCSE Geography Paper 2 Mapwork Question?
Which of the following is NOT a typical component assessed in the IGCSE Geography Paper 2 Mapwork Question?
- Four- and six-figure grid references
- Measuring distances and cross-sections
- Understanding and interpreting contour lines
- Analysis of weather patterns using synoptic charts (correct)
When describing an area on a map, including specific details like names is unnecessary if a general location is provided.
When describing an area on a map, including specific details like names is unnecessary if a general location is provided.
False (B)
Explain how the scale of a map affects the level of detail that can be represented and provide an example.
Explain how the scale of a map affects the level of detail that can be represented and provide an example.
A larger scale map (e.g., 1:25000) allows for more detail to be shown, such as individual buildings, whereas a smaller scale map (e.g., 1:50000) shows less detail and is better for representing larger areas.
On a topographical map, lines connecting points of equal elevation are called ______.
On a topographical map, lines connecting points of equal elevation are called ______.
Match each settlement pattern with its description:
Match each settlement pattern with its description:
Which type of graph is most suitable for showing how three related pieces of data contribute to a total of 100%, like the composition of primary, secondary, and tertiary industries in a region?
Which type of graph is most suitable for showing how three related pieces of data contribute to a total of 100%, like the composition of primary, secondary, and tertiary industries in a region?
A uniform slope, as represented by contour lines on a topographic map, is indicated by contour lines that increase evenly in height.
A uniform slope, as represented by contour lines on a topographic map, is indicated by contour lines that increase evenly in height.
Explain how human interaction with nature can lead to the promotion of tourism, providing two distinct examples.
Explain how human interaction with nature can lead to the promotion of tourism, providing two distinct examples.
The direction of a river is always described as flowing from ______ land.
The direction of a river is always described as flowing from ______ land.
Match the following map features with their respective descriptions:
Match the following map features with their respective descriptions:
When measuring curved distances on a map, which method is most accurate?
When measuring curved distances on a map, which method is most accurate?
Spot heights on a topographical map indicate points of equal altitude.
Spot heights on a topographical map indicate points of equal altitude.
Describe two factors that might indicate a natural advantage for the location of a settlement.
Describe two factors that might indicate a natural advantage for the location of a settlement.
In the 16-point compass, each sub-sub-division represents an angle of ______ degrees.
In the 16-point compass, each sub-sub-division represents an angle of ______ degrees.
Match the descriptions with the corresponding river landscape features:
Match the descriptions with the corresponding river landscape features:
Which of these is NOT an advantage of creating a field sketch rather than taking a photograph of a study area?
Which of these is NOT an advantage of creating a field sketch rather than taking a photograph of a study area?
Straight roads in a settlement typically indicate suburban, privately-owned detached houses.
Straight roads in a settlement typically indicate suburban, privately-owned detached houses.
How do contour lines indicate a steep slope on a topographical map?
How do contour lines indicate a steep slope on a topographical map?
Maps which are shaded according to a pre-arranged key are called a ______ map.
Maps which are shaded according to a pre-arranged key are called a ______ map.
Match each slope type with its description:
Match each slope type with its description:
Flashcards
Mapwork Question
Mapwork Question
A question style in Paper 2 worth 20/60 marks.
Short answer questions
Short answer questions
Questions in Paper 2 worth 8 marks each totaling 40/60 marks.
Four-/Six-Figure Grid Reference
Four-/Six-Figure Grid Reference
A system for locating points on a map using vertical and horizontal lines.
Bearings
Bearings
Signup and view all the flashcards
Straight roads
Straight roads
Signup and view all the flashcards
Relief
Relief
Signup and view all the flashcards
Gradient
Gradient
Signup and view all the flashcards
Natural Advantages.
Natural Advantages.
Signup and view all the flashcards
Human Locational Factors
Human Locational Factors
Signup and view all the flashcards
Settlement patterns
Settlement patterns
Signup and view all the flashcards
Settlement Patterns
Settlement Patterns
Signup and view all the flashcards
Cross-sections
Cross-sections
Signup and view all the flashcards
Describing photos
Describing photos
Signup and view all the flashcards
Line Graph
Line Graph
Signup and view all the flashcards
Pie Chart
Pie Chart
Signup and view all the flashcards
Contour Lines
Contour Lines
Signup and view all the flashcards
Measuring Curved Distances
Measuring Curved Distances
Signup and view all the flashcards
Four figure grid reference
Four figure grid reference
Signup and view all the flashcards
Study Notes
Overview of Paper 2
- IGCSE Geography Paper 2 is assessed in 2 sections:
- Mapwork Question (Question 1) worth 20/60 marks
- Short answer, evidence-based questions (Questions 2–6) worth 8 marks each, totaling 40/60 marks.
- Equipment allowed: pencil, rubber, ruler, protractor, calculator, string, and plain paper for measuring distances and cross-sections.
Question 1: Mapwork Question
- Assesses skills in:
- Four- and six-figure grid references
- Using 16-point cardinal directions
- Measuring distances and cross-sections
- Understanding and interpreting contour lines
- Identifying human and landscape features using the map key
- Identifying, describing, explaining, analyzing, and drawing inferences on physical and human landscapes (including patterns) using map evidence
- Giving brief descriptions of basic landscape features using geographical terms
- Drawing sketch maps illustrating patterns of both human and physical nature
- Questions worth the most marks typically involve:
- Interpreting urban morphology on large-scale maps
- Describing functions and services of settlements
- Providing reasons for the site and growth of individual settlements
- Recognizing communication networks in terms of their type and density related to physical and human features
Questions 2–6
- Questions are based on studied themes.
- Resources provided may include maps, graphs, diagrams, photos, sketches, and small paragraphs.
- Possible tasks include identifying features, describing figures, explaining occurrences, recalling facts, and comparing resources.
Structure of Questions
- Question types include:
- Map-based questions requiring description, explanation, and prediction
- Photo-based resources requiring identification and explanation
- Long answer questions asking for compare and contrast
- Diagram and graph-based questions to describe changes, distributions and patterns Rare question types include:
- Describing or drawing field sketches.
- Plotting data on a diagram (typically in Paper 4).
Topographical Map Skills
- Map skills build from basic to complex.
- Example: Four-figure grid reference of a tourist information center is 4733.
- Example: Six-figure grid reference of a tourist information center is 476334.
Compass Rose and Bearings
- Used to describe locations.
- The IGCSE requires direction on a 16 point compass.
- Bearings give direction in degrees, starting from north.
- North = 0° (or 000 bearing), East = 90° (090 bearing), South = 180° (180 bearing), West = 270° (270 bearing).
- Each sub-division on a compass is 22.5°.
- Direction is stated FROM and TO.
- Wind is named by the direction it blows from.
- Rivers flow from high to low land.
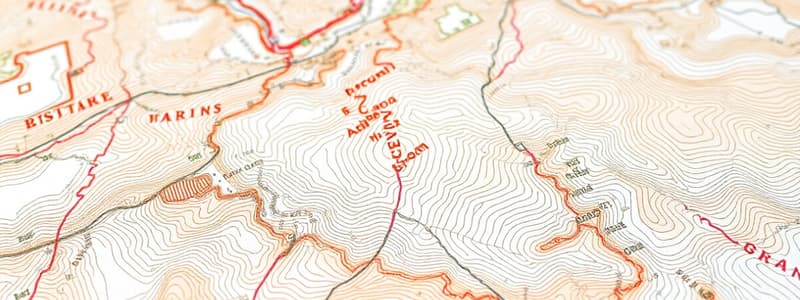
Maps - Contours and Gradient
- Contour lines connect points of equal altitude (elevation above sea level).
- Altitude is measured in meters from sea level.
- Contours appear at regular intervals.
- Spot heights (e.g., 398) are on trigonometrical points.
- Gradient is calculated as Vertical Interval (difference in height) / Horizontal Equivalent (horizontal distance).
Patterns of Contours
- Used to interpret map features
Distances
- Maps in IGCSE exams are at scales of 1:25000 or 1:50000.
- Scale is provided on the map and in the exam paper.
- Scale 1:25000 means 1 cm on the map equals 0.25 km in reality.
- Scale 1:50000 means 1 cm on the map equals 0.5 km in reality.
- Straight distances are measured using a piece of paper and the scale.
- Curved distances are measured using a piece of paper or string.
Describing an Area
- Include:
- General statement (location, direction, specific details).
- Physical features (contour, relief, spot height).
- Human features (land use, settlement).
- If contour lines go inward, there is a valley.
- Exotic forests are a human feature (introduced forest).
Cross-Sections
- Describe the following when interpreting a cross-section:
- Concave or convex slopes
- Steep or gentle gradient
- Maximum height
- Type of feature (hill, mountain, plateau etc.)
- Characteristics (broad, flat)
- Features the cross-section cuts through
- Changes throughout the cross-section
Patterns and Features - Settlement
- Settlement patterns include isolated, dispersed, nucleated, and linear arrangements.
- Street patterns and residential types:
- Straight roads typically indicate terraced housing
- Curved roads and cul-de-sacs often represent suburban detached houses.
- Natural advantages for settlements: flat land, water source, coastal location, farmland, natural resources, defensive position.
- Human locational factors: good road links, schools, hospitals, jobs, leisure facilities.
- Natural features: bays, headlands, river valleys, mountains, mangroves, forests.
- Land uses: agricultural, residential, industrial.
- Area functions: tourism, educational, and fishing.
- Features promoting tourism: beaches, sea, mountain scenery, waterfalls, museums, historical buildings, water parks, golf courses, hotels and restaurants.
Describing Patterns - Terrain
- Terrain height and shape is based on spot heights, index and interval contours, and contour shape.
- Convex slope: contours are closer at the bottom.
- Concave slope: contours are further apart at the bottom.
- Uniform slope: contour decreases evenly.
- Depressions: height decreases towards the center.
- Valleys intrude, ridges protrude.
River Landscapes
- Associated features with river landscapes described
Field Sketches and Photos
- Field sketches are useful when:
- No map exists
- A map has excess or insufficient detail
- A camera is unavailable
- Unwanted detail needs to be removed
- Labels or annotations are required
- Description of photographs should include: structure, vegetation, and geographical features.
Graphs
- Graphs include:
- Line graphs for continuous data
- Bar graphs for related but non-constant data
- Pie charts for data out of 100%
- Divided bar graphs for data adding up to 100%
- Histograms are like bar graphs but for one data type
- Scatter graphs for the relationship between two variables
- Isoline maps for weather data
- Triangular graphs for three related pieces of data totaling 100%
- Radial (kite) graphs for related data scored out of the same amount
- Wind rose graphs for wind speed and direction
- Kite diagrams for transects such as river velocity change
- Flow (system) diagrams to show multiplier effects or complex relationships
- When describing graphs, consider:
- Trends (positive/negative correlation, constant, fluctuating data).
- Anomalies
- Start and finish figures
- Highest and lowest figures
- Figures (evidence) for support
Other Important Considerations
- Drainage density: the greater the number of streams, the higher the density.
- Stream patterns: dendritic, trellis, or radial.
- Area drained: many tributaries joining the main river.
- Direction of flow.
- Course of river: straight, meandering, braiding, width.
- Presence of river features (rapids, waterfall).
- Choropleth maps are shaded according to a pre-arranged key.
Studying That Suits You
Use AI to generate personalized quizzes and flashcards to suit your learning preferences.


