Podcast
Play an AI-generated podcast conversation about this lesson
Questions and Answers
What does the lower class limit refer to in a frequency distribution?
What does the lower class limit refer to in a frequency distribution?
- The midpoint of the class interval
- The total frequency of the class
- The lowest value that can fall into the class (correct)
- The highest observation in the class
Which of the following best describes class boundaries?
Which of the following best describes class boundaries?
- The exact limits of the class interval
- The sum of the lower and upper class limits
- The average of the class interval
- The values that separate each class without gaps (correct)
In constructing a frequency histogram, what does the width of each bar represent?
In constructing a frequency histogram, what does the width of each bar represent?
- The cumulative frequency of the preceding class
- The class interval size (correct)
- The total frequency of all classes
- The class boundaries
What does the frequency ogive represent visually?
What does the frequency ogive represent visually?
Signup and view all the answers
How is the number of observations greater than a certain value determined from a frequency distribution?
How is the number of observations greater than a certain value determined from a frequency distribution?
Signup and view all the answers
Flashcards are hidden until you start studying
Study Notes
Descriptive Statistics Overview
- Focus on summarizing and describing data using measures such as central tendency and variability.
- Often involves calculating mean, median, mode, range, and standard deviation.
Frequency Distribution
- Represents how often each value or range of values occurs within a dataset.
- Key columns include:
- Class Interval: Range of values grouped together.
- Frequency: Number of occurrences within each class interval.
- Class Boundaries: Values that separate classes, ensuring no gaps.
- Cumulative Frequency: Running total of frequencies up to a certain class.
Frequency Polygon
- A graph that connects the midpoints of class intervals with line segments, illustrating frequency distribution visually.
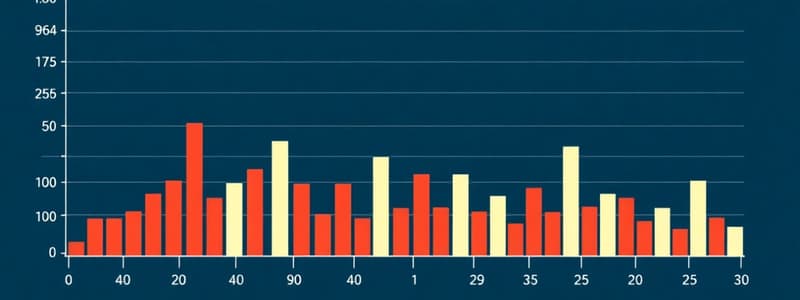
Histogram and Ogive
- Histogram: Bar graph that represents frequency distributions.
- Frequency Ogive: Cumulative frequency graph, showing the accumulation of frequencies over the class intervals.
Questions to Explore
- Identify the lower class limit for the lowest data class, crucial for understanding data distribution.
- Determine the lower class boundary for the highest class, which aids in analyzing extreme values.
- Calculate class width: the difference between the upper and lower class limits of any class.
- Calculate total observations (n): the sum of all frequencies, providing insight into dataset size.
- Determine number of observations below a specific value (e.g., 15.7) for localized data analysis.
- Identify observations greater than a certain value (e.g., 15.45) to understand data distribution.
- Find the number of observations within a specified range (e.g., between 14.45 and 15.95) to analyze data concentration in that interval.
Studying That Suits You
Use AI to generate personalized quizzes and flashcards to suit your learning preferences.