Podcast
Play an AI-generated podcast conversation about this lesson
Download our mobile app to listen on the go
Get App
Questions and Answers
Which of the following best describes a correlation diagram?
Which of the following best describes a correlation diagram?
- A chart that illustrates the regression line
- A diagram that shows the correlation coefficient
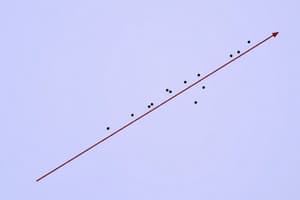
- A graph that displays the scatter plot of data points
- A visual representation of the relationship between two variables (correct)
What does a correlation coefficient indicate in a correlation diagram?
What does a correlation coefficient indicate in a correlation diagram?
- The significance level of the correlation
- The strength and direction of the relationship between two variables (correct)
- The standard deviation of the variables
- The mean of the variables
What does a scatter plot in a correlation diagram represent?
What does a scatter plot in a correlation diagram represent?
- The regression line for the variables
- The correlation coefficient for the variables
- The distribution of data points for two variables (correct)
- The mean of the variables
Flashcards are hidden until you start studying